African vs Central American Indian Median Male Earnings
COMPARE
African
Central American Indian
Median Male Earnings
Median Male Earnings Comparison
Africans
Central American Indians
$47,994
MEDIAN MALE EARNINGS
0.2/ 100
METRIC RATING
284th/ 347
METRIC RANK
$47,433
MEDIAN MALE EARNINGS
0.1/ 100
METRIC RATING
295th/ 347
METRIC RANK
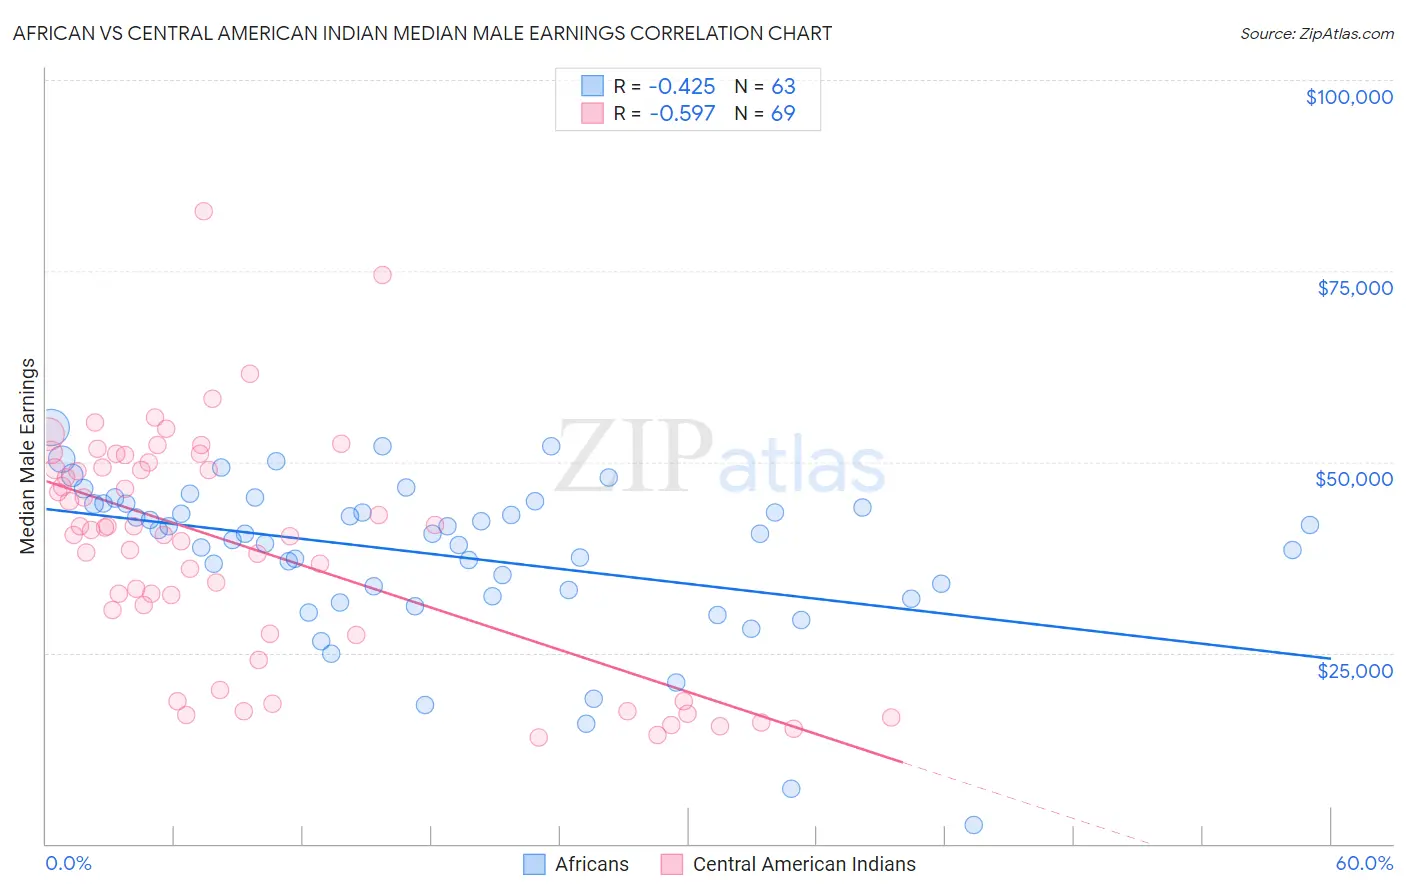
African vs Central American Indian Median Male Earnings Correlation Chart
The statistical analysis conducted on geographies consisting of 469,793,232 people shows a moderate negative correlation between the proportion of Africans and median male earnings in the United States with a correlation coefficient (R) of -0.425 and weighted average of $47,994. Similarly, the statistical analysis conducted on geographies consisting of 326,058,906 people shows a substantial negative correlation between the proportion of Central American Indians and median male earnings in the United States with a correlation coefficient (R) of -0.597 and weighted average of $47,433, a difference of 1.2%.
Median Male Earnings Correlation Summary
| Measurement | African | Central American Indian |
| Minimum | $2,499 | $13,893 |
| Maximum | $54,569 | $82,778 |
| Range | $52,070 | $68,885 |
| Mean | $37,853 | $38,816 |
| Median | $40,627 | $41,080 |
| Interquartile 25% (IQ1) | $32,413 | $27,422 |
| Interquartile 75% (IQ3) | $44,491 | $49,572 |
| Interquartile Range (IQR) | $12,079 | $22,150 |
| Standard Deviation (Sample) | $10,360 | $15,153 |
| Standard Deviation (Population) | $10,278 | $15,043 |
Demographics Similar to Africans and Central American Indians by Median Male Earnings
In terms of median male earnings, the demographic groups most similar to Africans are Paiute ($47,991, a difference of 0.010%), Mexican American Indian ($47,990, a difference of 0.010%), Immigrants from El Salvador ($47,973, a difference of 0.040%), Immigrants from Jamaica ($48,040, a difference of 0.090%), and Shoshone ($47,930, a difference of 0.13%). Similarly, the demographic groups most similar to Central American Indians are Immigrants from Nicaragua ($47,482, a difference of 0.10%), Indonesian ($47,503, a difference of 0.15%), Inupiat ($47,281, a difference of 0.32%), Immigrants from Dominica ($47,651, a difference of 0.46%), and Dominican ($47,204, a difference of 0.48%).
| Demographics | Rating | Rank | Median Male Earnings |
| Hmong | 0.2 /100 | #279 | Tragic $48,254 |
| Comanche | 0.2 /100 | #280 | Tragic $48,202 |
| Marshallese | 0.2 /100 | #281 | Tragic $48,137 |
| Central Americans | 0.2 /100 | #282 | Tragic $48,093 |
| Immigrants | Jamaica | 0.2 /100 | #283 | Tragic $48,040 |
| Africans | 0.2 /100 | #284 | Tragic $47,994 |
| Paiute | 0.2 /100 | #285 | Tragic $47,991 |
| Mexican American Indians | 0.2 /100 | #286 | Tragic $47,990 |
| Immigrants | El Salvador | 0.2 /100 | #287 | Tragic $47,973 |
| Shoshone | 0.2 /100 | #288 | Tragic $47,930 |
| Chickasaw | 0.1 /100 | #289 | Tragic $47,832 |
| Immigrants | Belize | 0.1 /100 | #290 | Tragic $47,809 |
| Choctaw | 0.1 /100 | #291 | Tragic $47,729 |
| Immigrants | Dominica | 0.1 /100 | #292 | Tragic $47,651 |
| Indonesians | 0.1 /100 | #293 | Tragic $47,503 |
| Immigrants | Nicaragua | 0.1 /100 | #294 | Tragic $47,482 |
| Central American Indians | 0.1 /100 | #295 | Tragic $47,433 |
| Inupiat | 0.1 /100 | #296 | Tragic $47,281 |
| Dominicans | 0.1 /100 | #297 | Tragic $47,204 |
| Immigrants | Micronesia | 0.1 /100 | #298 | Tragic $47,177 |
| Immigrants | Zaire | 0.1 /100 | #299 | Tragic $47,070 |