African vs Soviet Union Median Male Earnings
COMPARE
African
Soviet Union
Median Male Earnings
Median Male Earnings Comparison
Africans
Soviet Union
$47,994
MEDIAN MALE EARNINGS
0.2/ 100
METRIC RATING
284th/ 347
METRIC RANK
$63,382
MEDIAN MALE EARNINGS
100.0/ 100
METRIC RATING
32nd/ 347
METRIC RANK
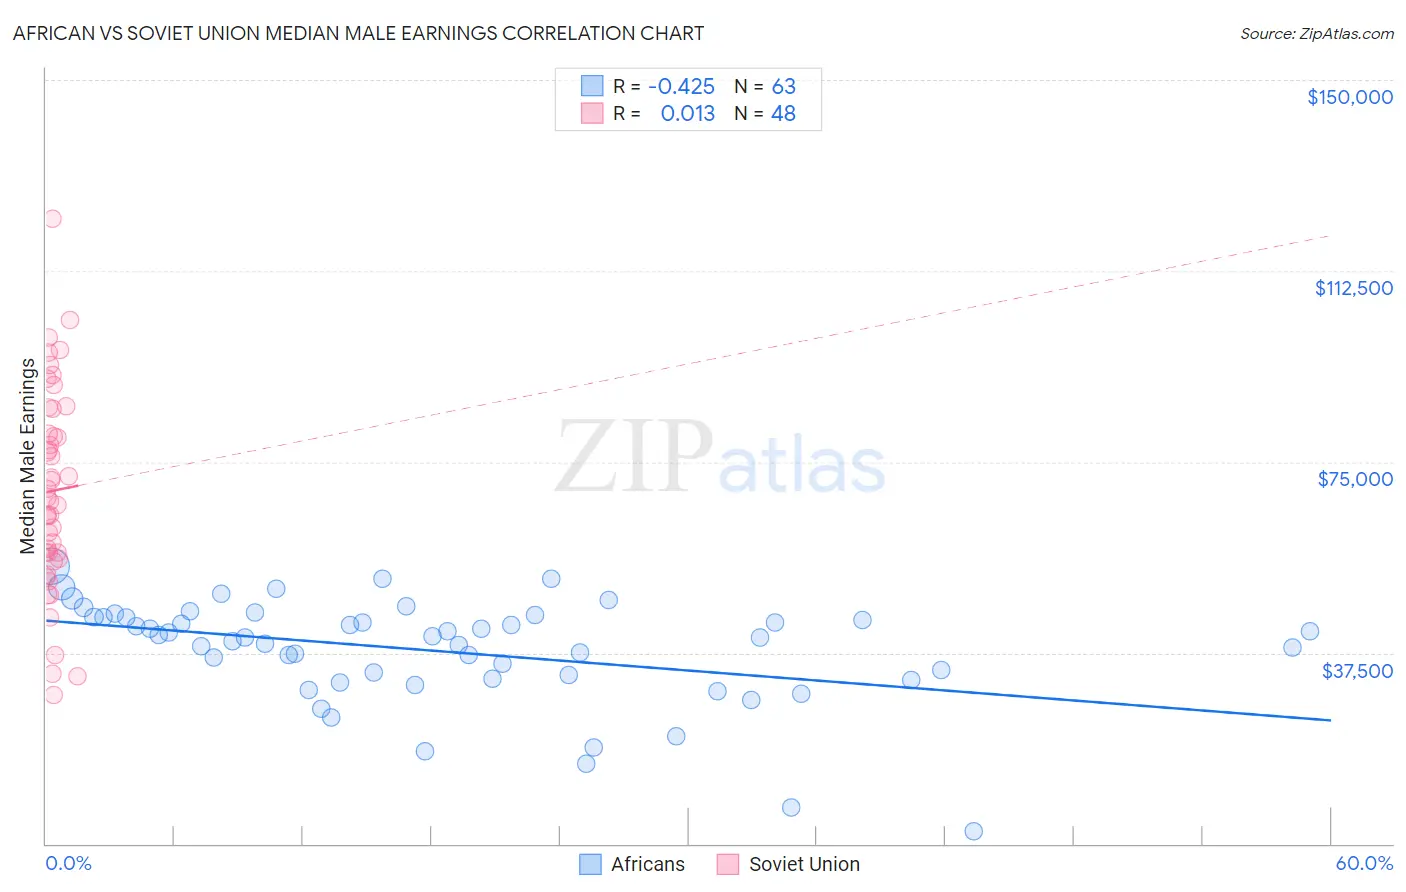
African vs Soviet Union Median Male Earnings Correlation Chart
The statistical analysis conducted on geographies consisting of 469,793,232 people shows a moderate negative correlation between the proportion of Africans and median male earnings in the United States with a correlation coefficient (R) of -0.425 and weighted average of $47,994. Similarly, the statistical analysis conducted on geographies consisting of 43,507,869 people shows no correlation between the proportion of Soviet Union and median male earnings in the United States with a correlation coefficient (R) of 0.013 and weighted average of $63,382, a difference of 32.1%.
Median Male Earnings Correlation Summary
| Measurement | African | Soviet Union |
| Minimum | $2,499 | $29,197 |
| Maximum | $54,569 | $122,813 |
| Range | $52,070 | $93,616 |
| Mean | $37,853 | $69,321 |
| Median | $40,627 | $67,564 |
| Interquartile 25% (IQ1) | $32,413 | $56,498 |
| Interquartile 75% (IQ3) | $44,491 | $82,953 |
| Interquartile Range (IQR) | $12,079 | $26,455 |
| Standard Deviation (Sample) | $10,360 | $19,957 |
| Standard Deviation (Population) | $10,278 | $19,748 |
Similar Demographics by Median Male Earnings
Demographics Similar to Africans by Median Male Earnings
In terms of median male earnings, the demographic groups most similar to Africans are Paiute ($47,991, a difference of 0.010%), Mexican American Indian ($47,990, a difference of 0.010%), Immigrants from El Salvador ($47,973, a difference of 0.040%), Immigrants from Jamaica ($48,040, a difference of 0.090%), and Shoshone ($47,930, a difference of 0.13%).
| Demographics | Rating | Rank | Median Male Earnings |
| Belizeans | 0.2 /100 | #277 | Tragic $48,358 |
| Immigrants | Liberia | 0.2 /100 | #278 | Tragic $48,317 |
| Hmong | 0.2 /100 | #279 | Tragic $48,254 |
| Comanche | 0.2 /100 | #280 | Tragic $48,202 |
| Marshallese | 0.2 /100 | #281 | Tragic $48,137 |
| Central Americans | 0.2 /100 | #282 | Tragic $48,093 |
| Immigrants | Jamaica | 0.2 /100 | #283 | Tragic $48,040 |
| Africans | 0.2 /100 | #284 | Tragic $47,994 |
| Paiute | 0.2 /100 | #285 | Tragic $47,991 |
| Mexican American Indians | 0.2 /100 | #286 | Tragic $47,990 |
| Immigrants | El Salvador | 0.2 /100 | #287 | Tragic $47,973 |
| Shoshone | 0.2 /100 | #288 | Tragic $47,930 |
| Chickasaw | 0.1 /100 | #289 | Tragic $47,832 |
| Immigrants | Belize | 0.1 /100 | #290 | Tragic $47,809 |
| Choctaw | 0.1 /100 | #291 | Tragic $47,729 |
Demographics Similar to Soviet Union by Median Male Earnings
In terms of median male earnings, the demographic groups most similar to Soviet Union are Immigrants from Lithuania ($63,346, a difference of 0.060%), Immigrants from Russia ($63,326, a difference of 0.090%), Latvian ($63,498, a difference of 0.18%), Immigrants from Asia ($63,240, a difference of 0.22%), and Israeli ($63,228, a difference of 0.24%).
| Demographics | Rating | Rank | Median Male Earnings |
| Immigrants | Denmark | 100.0 /100 | #25 | Exceptional $64,625 |
| Turks | 100.0 /100 | #26 | Exceptional $64,253 |
| Immigrants | Switzerland | 100.0 /100 | #27 | Exceptional $63,944 |
| Russians | 100.0 /100 | #28 | Exceptional $63,939 |
| Asians | 100.0 /100 | #29 | Exceptional $63,827 |
| Immigrants | France | 100.0 /100 | #30 | Exceptional $63,715 |
| Latvians | 100.0 /100 | #31 | Exceptional $63,498 |
| Soviet Union | 100.0 /100 | #32 | Exceptional $63,382 |
| Immigrants | Lithuania | 100.0 /100 | #33 | Exceptional $63,346 |
| Immigrants | Russia | 100.0 /100 | #34 | Exceptional $63,326 |
| Immigrants | Asia | 100.0 /100 | #35 | Exceptional $63,240 |
| Israelis | 100.0 /100 | #36 | Exceptional $63,228 |
| Immigrants | Sri Lanka | 100.0 /100 | #37 | Exceptional $63,099 |
| Maltese | 100.0 /100 | #38 | Exceptional $62,953 |
| Immigrants | South Africa | 100.0 /100 | #39 | Exceptional $62,899 |