Austrian vs Immigrants from Cameroon Median Male Earnings
COMPARE
Austrian
Immigrants from Cameroon
Median Male Earnings
Median Male Earnings Comparison
Austrians
Immigrants from Cameroon
$59,359
MEDIAN MALE EARNINGS
99.2/ 100
METRIC RATING
90th/ 347
METRIC RANK
$52,119
MEDIAN MALE EARNINGS
8.9/ 100
METRIC RATING
215th/ 347
METRIC RANK
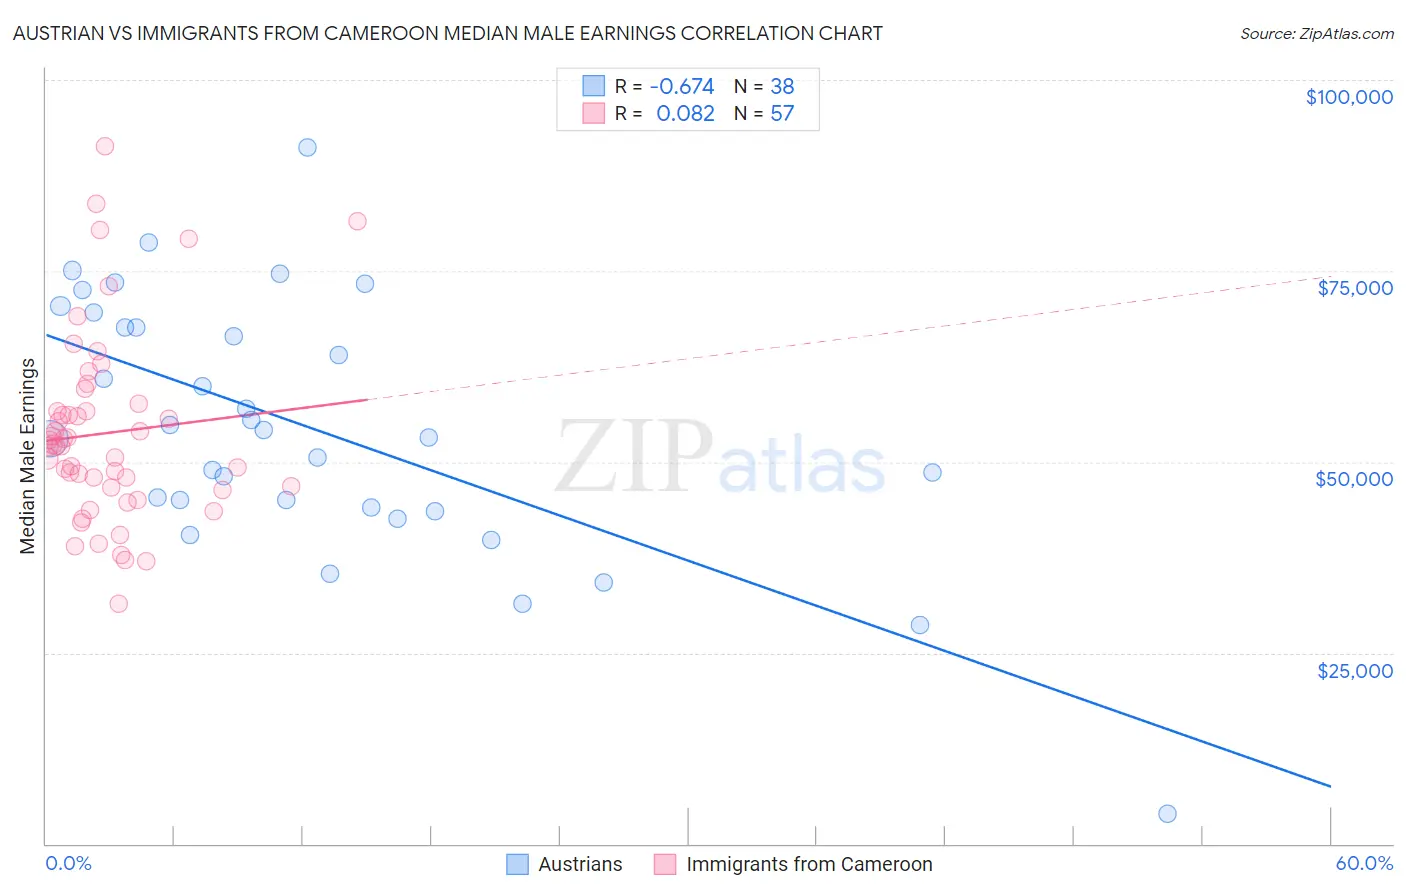
Austrian vs Immigrants from Cameroon Median Male Earnings Correlation Chart
The statistical analysis conducted on geographies consisting of 451,854,520 people shows a significant negative correlation between the proportion of Austrians and median male earnings in the United States with a correlation coefficient (R) of -0.674 and weighted average of $59,359. Similarly, the statistical analysis conducted on geographies consisting of 130,759,044 people shows a slight positive correlation between the proportion of Immigrants from Cameroon and median male earnings in the United States with a correlation coefficient (R) of 0.082 and weighted average of $52,119, a difference of 13.9%.
Median Male Earnings Correlation Summary
| Measurement | Austrian | Immigrants from Cameroon |
| Minimum | $3,902 | $31,418 |
| Maximum | $91,143 | $91,296 |
| Range | $87,241 | $59,878 |
| Mean | $54,430 | $53,781 |
| Median | $53,632 | $52,076 |
| Interquartile 25% (IQ1) | $43,967 | $46,476 |
| Interquartile 75% (IQ3) | $67,629 | $57,139 |
| Interquartile Range (IQR) | $23,662 | $10,663 |
| Standard Deviation (Sample) | $16,958 | $12,326 |
| Standard Deviation (Population) | $16,734 | $12,218 |
Similar Demographics by Median Male Earnings
Demographics Similar to Austrians by Median Male Earnings
In terms of median male earnings, the demographic groups most similar to Austrians are Laotian ($59,351, a difference of 0.010%), Immigrants from Moldova ($59,417, a difference of 0.10%), Immigrants from Kazakhstan ($59,278, a difference of 0.14%), Immigrants from Argentina ($59,491, a difference of 0.22%), and Immigrants from Southern Europe ($59,217, a difference of 0.24%).
| Demographics | Rating | Rank | Median Male Earnings |
| Immigrants | Italy | 99.4 /100 | #83 | Exceptional $59,691 |
| Afghans | 99.3 /100 | #84 | Exceptional $59,554 |
| Italians | 99.3 /100 | #85 | Exceptional $59,551 |
| Immigrants | England | 99.3 /100 | #86 | Exceptional $59,527 |
| Macedonians | 99.3 /100 | #87 | Exceptional $59,522 |
| Immigrants | Argentina | 99.3 /100 | #88 | Exceptional $59,491 |
| Immigrants | Moldova | 99.2 /100 | #89 | Exceptional $59,417 |
| Austrians | 99.2 /100 | #90 | Exceptional $59,359 |
| Laotians | 99.2 /100 | #91 | Exceptional $59,351 |
| Immigrants | Kazakhstan | 99.1 /100 | #92 | Exceptional $59,278 |
| Immigrants | Southern Europe | 99.0 /100 | #93 | Exceptional $59,217 |
| Immigrants | North Macedonia | 99.0 /100 | #94 | Exceptional $59,189 |
| Immigrants | Lebanon | 98.6 /100 | #95 | Exceptional $58,835 |
| Albanians | 98.4 /100 | #96 | Exceptional $58,680 |
| Northern Europeans | 98.2 /100 | #97 | Exceptional $58,588 |
Demographics Similar to Immigrants from Cameroon by Median Male Earnings
In terms of median male earnings, the demographic groups most similar to Immigrants from Cameroon are Nonimmigrants ($52,170, a difference of 0.10%), Immigrants from Venezuela ($52,041, a difference of 0.15%), Nigerian ($52,039, a difference of 0.15%), Immigrants from Panama ($51,962, a difference of 0.30%), and Native Hawaiian ($52,306, a difference of 0.36%).
| Demographics | Rating | Rank | Median Male Earnings |
| Venezuelans | 12.5 /100 | #208 | Poor $52,510 |
| Bermudans | 12.1 /100 | #209 | Poor $52,465 |
| Delaware | 11.5 /100 | #210 | Poor $52,412 |
| Tlingit-Haida | 11.5 /100 | #211 | Poor $52,409 |
| Cajuns | 10.7 /100 | #212 | Poor $52,325 |
| Native Hawaiians | 10.5 /100 | #213 | Poor $52,306 |
| Immigrants | Nonimmigrants | 9.3 /100 | #214 | Tragic $52,170 |
| Immigrants | Cameroon | 8.9 /100 | #215 | Tragic $52,119 |
| Immigrants | Venezuela | 8.3 /100 | #216 | Tragic $52,041 |
| Nigerians | 8.3 /100 | #217 | Tragic $52,039 |
| Immigrants | Panama | 7.7 /100 | #218 | Tragic $51,962 |
| Immigrants | Ghana | 6.9 /100 | #219 | Tragic $51,836 |
| Immigrants | Armenia | 6.6 /100 | #220 | Tragic $51,793 |
| Immigrants | Senegal | 5.8 /100 | #221 | Tragic $51,647 |
| Immigrants | Bangladesh | 5.8 /100 | #222 | Tragic $51,642 |