African vs Immigrants from Cameroon 1st Grade
COMPARE
African
Immigrants from Cameroon
1st Grade
1st Grade Comparison
Africans
Immigrants from Cameroon
97.8%
1ST GRADE
16.5/ 100
METRIC RATING
207th/ 347
METRIC RANK
97.4%
1ST GRADE
0.2/ 100
METRIC RATING
271st/ 347
METRIC RANK
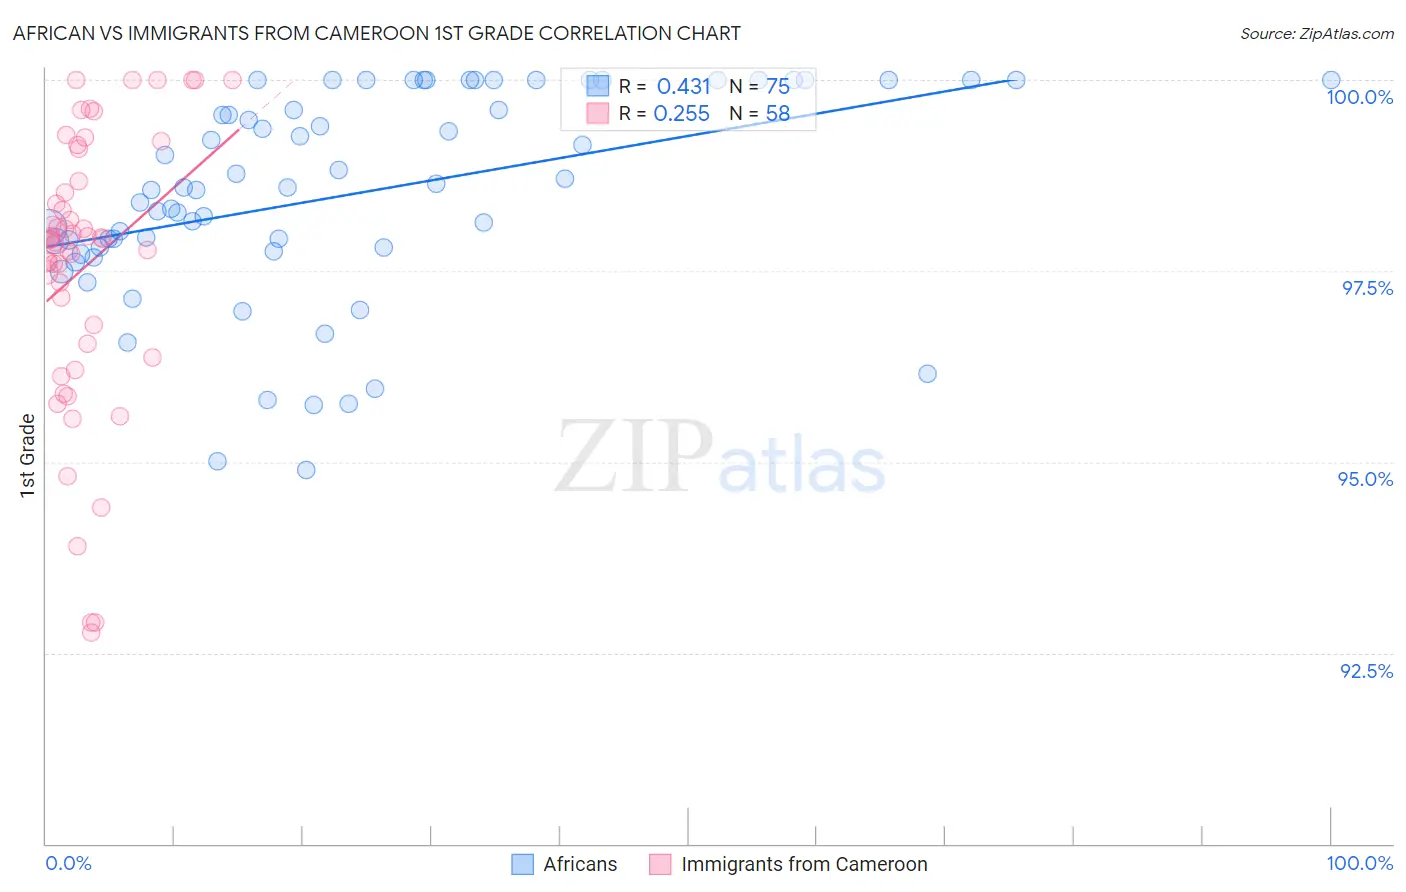
African vs Immigrants from Cameroon 1st Grade Correlation Chart
The statistical analysis conducted on geographies consisting of 470,094,148 people shows a moderate positive correlation between the proportion of Africans and percentage of population with at least 1st grade education in the United States with a correlation coefficient (R) of 0.431 and weighted average of 97.8%. Similarly, the statistical analysis conducted on geographies consisting of 130,752,798 people shows a weak positive correlation between the proportion of Immigrants from Cameroon and percentage of population with at least 1st grade education in the United States with a correlation coefficient (R) of 0.255 and weighted average of 97.4%, a difference of 0.36%.
1st Grade Correlation Summary
| Measurement | African | Immigrants from Cameroon |
| Minimum | 94.9% | 92.8% |
| Maximum | 100.0% | 100.0% |
| Range | 5.1% | 7.2% |
| Mean | 98.5% | 97.6% |
| Median | 98.6% | 97.9% |
| Interquartile 25% (IQ1) | 97.8% | 96.6% |
| Interquartile 75% (IQ3) | 100.0% | 98.7% |
| Interquartile Range (IQR) | 2.2% | 2.1% |
| Standard Deviation (Sample) | 1.4% | 1.8% |
| Standard Deviation (Population) | 1.4% | 1.8% |
Similar Demographics by 1st Grade
Demographics Similar to Africans by 1st Grade
In terms of 1st grade, the demographic groups most similar to Africans are Immigrants from Albania (97.8%, a difference of 0.0%), Immigrants from Ukraine (97.8%, a difference of 0.010%), Immigrants from Southern Europe (97.8%, a difference of 0.010%), Immigrants from Uganda (97.8%, a difference of 0.010%), and Immigrants from Chile (97.8%, a difference of 0.010%).
| Demographics | Rating | Rank | 1st Grade |
| Immigrants | Egypt | 22.6 /100 | #200 | Fair 97.8% |
| Immigrants | Lebanon | 20.1 /100 | #201 | Fair 97.8% |
| Immigrants | Ukraine | 19.2 /100 | #202 | Poor 97.8% |
| Immigrants | Southern Europe | 18.2 /100 | #203 | Poor 97.8% |
| Immigrants | Uganda | 18.2 /100 | #204 | Poor 97.8% |
| Immigrants | Chile | 17.7 /100 | #205 | Poor 97.8% |
| Immigrants | Albania | 17.3 /100 | #206 | Poor 97.8% |
| Africans | 16.5 /100 | #207 | Poor 97.8% |
| Immigrants | Northern Africa | 12.0 /100 | #208 | Poor 97.8% |
| Costa Ricans | 11.6 /100 | #209 | Poor 97.8% |
| Immigrants | Oceania | 11.0 /100 | #210 | Poor 97.8% |
| Laotians | 10.3 /100 | #211 | Poor 97.8% |
| Moroccans | 8.7 /100 | #212 | Tragic 97.7% |
| Immigrants | Bahamas | 8.1 /100 | #213 | Tragic 97.7% |
| South American Indians | 7.6 /100 | #214 | Tragic 97.7% |
Demographics Similar to Immigrants from Cameroon by 1st Grade
In terms of 1st grade, the demographic groups most similar to Immigrants from Cameroon are Immigrants from Peru (97.4%, a difference of 0.0%), Immigrants from Bolivia (97.4%, a difference of 0.0%), Immigrants from Jamaica (97.5%, a difference of 0.020%), West Indian (97.5%, a difference of 0.030%), and Ghanaian (97.4%, a difference of 0.030%).
| Demographics | Rating | Rank | 1st Grade |
| Taiwanese | 0.4 /100 | #264 | Tragic 97.5% |
| Cubans | 0.3 /100 | #265 | Tragic 97.5% |
| Immigrants | Liberia | 0.3 /100 | #266 | Tragic 97.5% |
| Immigrants | Sierra Leone | 0.3 /100 | #267 | Tragic 97.5% |
| Immigrants | Nigeria | 0.3 /100 | #268 | Tragic 97.5% |
| West Indians | 0.3 /100 | #269 | Tragic 97.5% |
| Immigrants | Jamaica | 0.2 /100 | #270 | Tragic 97.5% |
| Immigrants | Cameroon | 0.2 /100 | #271 | Tragic 97.4% |
| Immigrants | Peru | 0.2 /100 | #272 | Tragic 97.4% |
| Immigrants | Bolivia | 0.2 /100 | #273 | Tragic 97.4% |
| Ghanaians | 0.1 /100 | #274 | Tragic 97.4% |
| Immigrants | China | 0.1 /100 | #275 | Tragic 97.4% |
| Immigrants | Philippines | 0.1 /100 | #276 | Tragic 97.4% |
| Immigrants | Western Africa | 0.1 /100 | #277 | Tragic 97.4% |
| Immigrants | Uzbekistan | 0.1 /100 | #278 | Tragic 97.4% |