African vs Immigrants from Belarus Median Male Earnings
COMPARE
African
Immigrants from Belarus
Median Male Earnings
Median Male Earnings Comparison
Africans
Immigrants from Belarus
$47,994
MEDIAN MALE EARNINGS
0.2/ 100
METRIC RATING
284th/ 347
METRIC RANK
$62,658
MEDIAN MALE EARNINGS
100.0/ 100
METRIC RATING
43rd/ 347
METRIC RANK
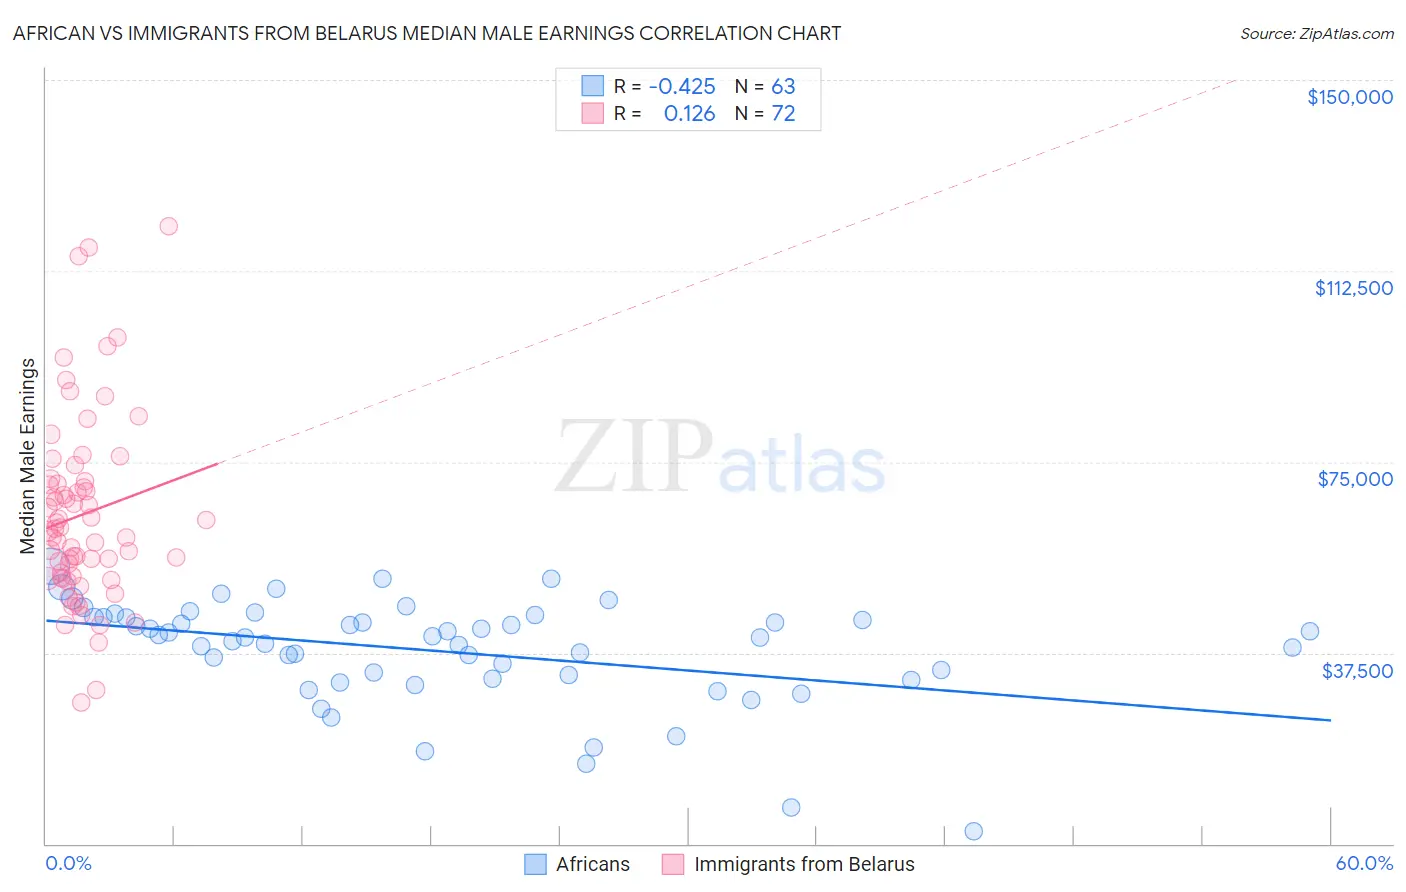
African vs Immigrants from Belarus Median Male Earnings Correlation Chart
The statistical analysis conducted on geographies consisting of 469,793,232 people shows a moderate negative correlation between the proportion of Africans and median male earnings in the United States with a correlation coefficient (R) of -0.425 and weighted average of $47,994. Similarly, the statistical analysis conducted on geographies consisting of 150,194,615 people shows a poor positive correlation between the proportion of Immigrants from Belarus and median male earnings in the United States with a correlation coefficient (R) of 0.126 and weighted average of $62,658, a difference of 30.5%.
Median Male Earnings Correlation Summary
| Measurement | African | Immigrants from Belarus |
| Minimum | $2,499 | $27,820 |
| Maximum | $54,569 | $121,250 |
| Range | $52,070 | $93,430 |
| Mean | $37,853 | $64,628 |
| Median | $40,627 | $61,571 |
| Interquartile 25% (IQ1) | $32,413 | $52,308 |
| Interquartile 75% (IQ3) | $44,491 | $70,925 |
| Interquartile Range (IQR) | $12,079 | $18,618 |
| Standard Deviation (Sample) | $10,360 | $18,362 |
| Standard Deviation (Population) | $10,278 | $18,234 |
Similar Demographics by Median Male Earnings
Demographics Similar to Africans by Median Male Earnings
In terms of median male earnings, the demographic groups most similar to Africans are Paiute ($47,991, a difference of 0.010%), Mexican American Indian ($47,990, a difference of 0.010%), Immigrants from El Salvador ($47,973, a difference of 0.040%), Immigrants from Jamaica ($48,040, a difference of 0.090%), and Shoshone ($47,930, a difference of 0.13%).
| Demographics | Rating | Rank | Median Male Earnings |
| Belizeans | 0.2 /100 | #277 | Tragic $48,358 |
| Immigrants | Liberia | 0.2 /100 | #278 | Tragic $48,317 |
| Hmong | 0.2 /100 | #279 | Tragic $48,254 |
| Comanche | 0.2 /100 | #280 | Tragic $48,202 |
| Marshallese | 0.2 /100 | #281 | Tragic $48,137 |
| Central Americans | 0.2 /100 | #282 | Tragic $48,093 |
| Immigrants | Jamaica | 0.2 /100 | #283 | Tragic $48,040 |
| Africans | 0.2 /100 | #284 | Tragic $47,994 |
| Paiute | 0.2 /100 | #285 | Tragic $47,991 |
| Mexican American Indians | 0.2 /100 | #286 | Tragic $47,990 |
| Immigrants | El Salvador | 0.2 /100 | #287 | Tragic $47,973 |
| Shoshone | 0.2 /100 | #288 | Tragic $47,930 |
| Chickasaw | 0.1 /100 | #289 | Tragic $47,832 |
| Immigrants | Belize | 0.1 /100 | #290 | Tragic $47,809 |
| Choctaw | 0.1 /100 | #291 | Tragic $47,729 |
Demographics Similar to Immigrants from Belarus by Median Male Earnings
In terms of median male earnings, the demographic groups most similar to Immigrants from Belarus are Immigrants from Greece ($62,689, a difference of 0.050%), Immigrants from Turkey ($62,728, a difference of 0.11%), Cambodian ($62,516, a difference of 0.23%), Australian ($62,857, a difference of 0.32%), and Immigrants from South Africa ($62,899, a difference of 0.38%).
| Demographics | Rating | Rank | Median Male Earnings |
| Israelis | 100.0 /100 | #36 | Exceptional $63,228 |
| Immigrants | Sri Lanka | 100.0 /100 | #37 | Exceptional $63,099 |
| Maltese | 100.0 /100 | #38 | Exceptional $62,953 |
| Immigrants | South Africa | 100.0 /100 | #39 | Exceptional $62,899 |
| Australians | 100.0 /100 | #40 | Exceptional $62,857 |
| Immigrants | Turkey | 100.0 /100 | #41 | Exceptional $62,728 |
| Immigrants | Greece | 100.0 /100 | #42 | Exceptional $62,689 |
| Immigrants | Belarus | 100.0 /100 | #43 | Exceptional $62,658 |
| Cambodians | 100.0 /100 | #44 | Exceptional $62,516 |
| Bulgarians | 100.0 /100 | #45 | Exceptional $62,378 |
| Immigrants | Czechoslovakia | 99.9 /100 | #46 | Exceptional $62,217 |
| Immigrants | Austria | 99.9 /100 | #47 | Exceptional $62,164 |
| Immigrants | Malaysia | 99.9 /100 | #48 | Exceptional $62,121 |
| Immigrants | Europe | 99.9 /100 | #49 | Exceptional $62,057 |
| Bhutanese | 99.9 /100 | #50 | Exceptional $61,759 |