Zip Codes with the Highest Percentage of Owner-Occupied Units in Indianapolis, IN

RELATED REPORTS & OPTIONS

Highest Owner-Occupied
Population
Families and Households
Female Fertility
Female Fertility (Unmarried)
Race (Community Size)
Race (Percentage)
Ancestry (Community Size)
AfghanAfricanAlaskan AthabascanAlbanianAlsatianAmericanApacheArabArgentineanArmenianAustralianAustrianBahamianBangladeshiBarbadianBasqueBelgianBelizeanBhutaneseBlackfeetBolivianBrazilianBritishBritish West IndianBulgarianBurmeseCajunCanadianCelticCentral AmericanCentral American IndianCherokeeChickasawChileanChippewaChoctawColombianCosta RicanCroatianCrowCubanCzechCzechoslovakianDanishDominicanDutchEastern EuropeanEcuadorianEgyptianEnglishEstonianEthiopianEuropeanFilipinoFinnishFrenchFrench CanadianGermanGerman RussianGhanaianGreekGuamanian / ChamorroGuatemalanGuyaneseHaitianHonduranHopiHungarianIcelanderIndian (Asian)IndonesianInupiatIranianIraqiIrishIroquoisIsraeliItalianJamaicanJapaneseJordanianKenyanKoreanLaotianLatvianLebaneseLiberianLithuanianLuxembourgerMacedonianMalaysianMenomineeMexicanMexican American IndianMongolianMoroccanNative HawaiianNavajoNew ZealanderNicaraguanNigerianNorthern EuropeanNorwegianPakistaniPalestinianPanamanianPennsylvania GermanPeruvianPolishPortuguesePotawatomiPuerto RicanRomanianRussianSalvadoranSamoanScandinavianScotch-IrishScottishSeminoleSenegaleseSerbianSierra LeoneanSiouxSlavicSlovakSloveneSouth AfricanSouth AmericanSouth American IndianSpaniardSpanishSri LankanSubsaharan AfricanSudaneseSwedishSwissSyrianThaiTonganTrinidadian and TobagonianTurkishUgandanUkrainianUruguayanVenezuelanVietnameseWelshWest IndianYugoslavianZimbabwean
Ancestry (Percentage)
AfghanAfricanAlaskan AthabascanAlbanianAlsatianAmericanApacheArabArgentineanArmenianAustralianAustrianBahamianBangladeshiBarbadianBasqueBelgianBelizeanBhutaneseBlackfeetBolivianBrazilianBritishBritish West IndianBulgarianBurmeseCajunCanadianCelticCentral AmericanCentral American IndianCherokeeChickasawChileanChippewaChoctawColombianCosta RicanCroatianCrowCubanCzechCzechoslovakianDanishDominicanDutchEastern EuropeanEcuadorianEgyptianEnglishEstonianEthiopianEuropeanFilipinoFinnishFrenchFrench CanadianGermanGerman RussianGhanaianGreekGuamanian / ChamorroGuatemalanGuyaneseHaitianHonduranHopiHungarianIcelanderIndian (Asian)IndonesianInupiatIranianIraqiIrishIroquoisIsraeliItalianJamaicanJapaneseJordanianKenyanKoreanLaotianLatvianLebaneseLiberianLithuanianLuxembourgerMacedonianMalaysianMenomineeMexicanMexican American IndianMongolianMoroccanNative HawaiianNavajoNew ZealanderNicaraguanNigerianNorthern EuropeanNorwegianPakistaniPalestinianPanamanianPennsylvania GermanPeruvianPolishPortuguesePotawatomiPuerto RicanRomanianRussianSalvadoranSamoanScandinavianScotch-IrishScottishSeminoleSenegaleseSerbianSierra LeoneanSiouxSlavicSlovakSloveneSouth AfricanSouth AmericanSouth American IndianSpaniardSpanishSri LankanSubsaharan AfricanSudaneseSwedishSwissSyrianThaiTonganTrinidadian and TobagonianTurkishUgandanUkrainianUruguayanVenezuelanVietnameseWelshWest IndianYugoslavianZimbabwean
Immigrant Origin (Total)
AfghanistanAfricaArgentinaAsiaAustraliaAustriaBahamasBangladeshBarbadosBelarusBoliviaBosnia and HerzegovinaBrazilBulgariaBurma / MyanmarCambodiaCameroonCanadaCaribbeanCentral AmericaChileChinaColombiaCongoCosta RicaCubaDenmarkDominican RepublicEastern AfricaEastern AsiaEastern EuropeEcuadorEgyptEl SalvadorEnglandEritreaEthiopiaEuropeFranceGermanyGhanaGreeceGuatemalaGuyanaHaitiHondurasHong KongHungaryIndiaIndonesiaIranIraqIrelandIsraelItalyJamaicaJapanJordanKenyaKoreaLaosLatin AmericaLatviaLebanonLiberiaMalaysiaMexicoMiddle AfricaMoldovaMoroccoNepalNetherlandsNicaraguaNigeriaNorth MacedoniaNorthern AfricaNorthern EuropeNorwayOceaniaPakistanPanamaPeruPhilippinesPolandPortugalRomaniaRussiaSaudi ArabiaScotlandSenegalSerbiaSierra LeoneSingaporeSouth AfricaSouth AmericaSouth Central AsiaSouth Eastern AsiaSouthern EuropeSpainSt. Vincent and the GrenadinesSudanSyriaTaiwanThailandTrinidad and TobagoTurkeyUgandaUkraineUzbekistanVenezuelaVietnamWest IndiesWestern AfricaWestern AsiaWestern EuropeYemenZaireZimbabwe
Immigrant Origin (Percentage)
AfghanistanAfricaArgentinaAsiaAustraliaAustriaBahamasBangladeshBarbadosBelarusBoliviaBosnia and HerzegovinaBrazilBulgariaBurma / MyanmarCambodiaCameroonCanadaCaribbeanCentral AmericaChileChinaColombiaCongoCosta RicaCubaDenmarkDominican RepublicEastern AfricaEastern AsiaEastern EuropeEcuadorEgyptEl SalvadorEnglandEritreaEthiopiaEuropeFranceGermanyGhanaGreeceGuatemalaGuyanaHaitiHondurasHong KongHungaryIndiaIndonesiaIranIraqIrelandIsraelItalyJamaicaJapanJordanKenyaKoreaLaosLatin AmericaLatviaLebanonLiberiaMalaysiaMexicoMiddle AfricaMoldovaMoroccoNepalNetherlandsNicaraguaNigeriaNorth MacedoniaNorthern AfricaNorthern EuropeNorwayOceaniaPakistanPanamaPeruPhilippinesPolandPortugalRomaniaRussiaSaudi ArabiaScotlandSenegalSerbiaSierra LeoneSingaporeSouth AfricaSouth AmericaSouth Central AsiaSouth Eastern AsiaSouthern EuropeSpainSt. Vincent and the GrenadinesSudanSyriaTaiwanThailandTrinidad and TobagoTurkeyUgandaUkraineUzbekistanVenezuelaVietnamWest IndiesWestern AfricaWestern AsiaWestern EuropeYemenZaireZimbabwe
Income
Income (Families)
Income (Households)
Poverty
Poverty (Families)
Unemployment
Employment Occupations
Employment Industries
Employer Class
Commute Time
Commute Means
School Enrollment
Education by Degree Field
Occupancy
Finances
Physical Characteristics
Indianapolis
Compare Zip Codes
Comparison Subject

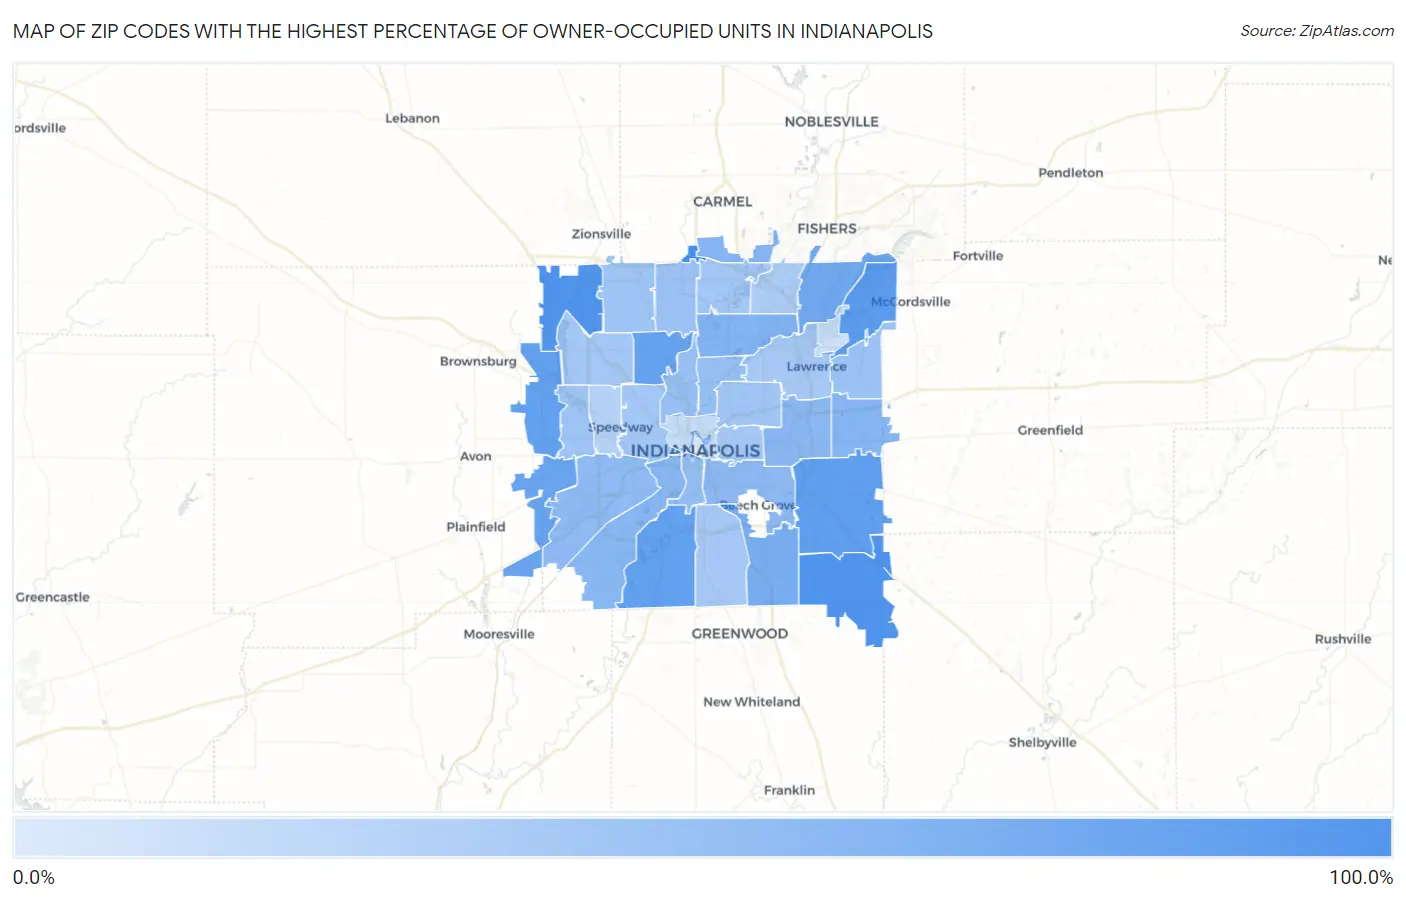
Map of Zip Codes with the Highest Percentage of Owner-Occupied Units in Indianapolis

0.0%
100.0%
Zip Codes with the Highest Percentage of Owner-Occupied Units in Indianapolis Map

Zip Codes with the Highest Percentage of Owner-Occupied Units in Indianapolis, IN

Zip Code % Owner-Occupied vs State vs National
1.46290100.0%70.1%(+29.9)#2764.8%(+35.2)#1,048
2.4625996.0%70.1%(+25.9)#6864.8%(+31.2)#2,366
3.4627894.1%70.1%(+24.0)#9264.8%(+29.3)#3,116
4.4623687.5%70.1%(+17.4)#20564.8%(+22.7)#7,403
5.4623982.9%70.1%(+12.8)#32564.8%(+18.1)#11,776
6.4623482.1%70.1%(+12.0)#35164.8%(+17.3)#12,572
7.4621781.4%70.1%(+11.2)#37364.8%(+16.5)#13,283
8.4622881.1%70.1%(+10.9)#38564.8%(+16.2)#13,587
9.4623177.7%70.1%(+7.59)#47664.8%(+12.9)#16,743
10.4625672.0%70.1%(+1.84)#58564.8%(+7.14)#21,444
11.4623768.7%70.1%(-1.38)#62364.8%(+3.92)#23,535
12.4622064.1%70.1%(-6.01)#66764.8%(-0.716)#25,877
13.4628061.6%70.1%(-8.49)#68764.8%(-3.19)#26,861
14.4622961.1%70.1%(-9.04)#69264.8%(-3.74)#27,072
15.4622160.0%70.1%(-10.2)#69864.8%(-4.85)#27,425
16.4621958.7%70.1%(-11.4)#70264.8%(-6.13)#27,804
17.4620357.7%70.1%(-12.4)#70564.8%(-7.07)#28,051
18.4624156.3%70.1%(-13.8)#71264.8%(-8.49)#28,417
19.4620552.7%70.1%(-17.4)#72264.8%(-12.1)#29,239
20.4622552.5%70.1%(-17.6)#72464.8%(-12.3)#29,275
21.4620852.2%70.1%(-18.0)#72564.8%(-12.7)#29,341
22.4623550.8%70.1%(-19.3)#72764.8%(-14.0)#29,583
23.4626048.8%70.1%(-21.3)#73164.8%(-16.0)#29,913
24.4626848.1%70.1%(-22.0)#73464.8%(-16.7)#30,042
25.4621447.6%70.1%(-22.6)#73664.8%(-17.3)#30,111
26.4621846.4%70.1%(-23.7)#74064.8%(-18.4)#30,288
27.4625445.6%70.1%(-24.5)#74264.8%(-19.2)#30,402
28.4624045.2%70.1%(-24.9)#74364.8%(-19.6)#30,450
29.4622245.1%70.1%(-25.0)#74464.8%(-19.7)#30,461
30.4620145.0%70.1%(-25.1)#74564.8%(-19.8)#30,478
31.4622744.5%70.1%(-25.6)#74864.8%(-20.3)#30,548
32.4622644.1%70.1%(-26.1)#74964.8%(-20.8)#30,602
33.4625041.6%70.1%(-28.5)#75864.8%(-23.2)#30,869
34.4622436.9%70.1%(-33.2)#76364.8%(-27.9)#31,276
35.4620229.8%70.1%(-40.3)#76864.8%(-35.0)#31,768
36.4621626.2%70.1%(-43.9)#77164.8%(-38.6)#31,941
37.4620419.5%70.1%(-50.6)#77564.8%(-45.3)#32,160

Common Questions

What are the Top 10 Zip Codes with the Highest Percentage of Owner-Occupied Units in Indianapolis, IN?
Top 10 Zip Codes with the Highest Percentage of Owner-Occupied Units in Indianapolis, IN are:
#1
100.0%
#2
96.0%
#3
94.1%
#4
87.5%
#5
82.9%
#6
82.1%
#7
81.4%
#8
81.1%
#9
77.7%
#10
72.0%
What zip code has the Highest Percentage of Owner-Occupied Units in Indianapolis, IN?
46290 has the Highest Percentage of Owner-Occupied Units in Indianapolis, IN with 100.0%.
What is the Percentage of Owner-Occupied Units in Indianapolis, IN?
Percentage of Owner-Occupied Units in Indianapolis is 54.9%.
What is the Percentage of Owner-Occupied Units in Indiana?
Percentage of Owner-Occupied Units in Indiana is 70.1%.
What is the Percentage of Owner-Occupied Units in the United States?
Percentage of Owner-Occupied Units in the United States is 64.8%.