Zip Codes with the Highest Percentage of Population Employed in Installation, Maintenance & Repair in Des Plaines, IL
RELATED REPORTS & OPTIONS
Installation, Maintenance & Repair
Des Plaines
Compare Zip Codes
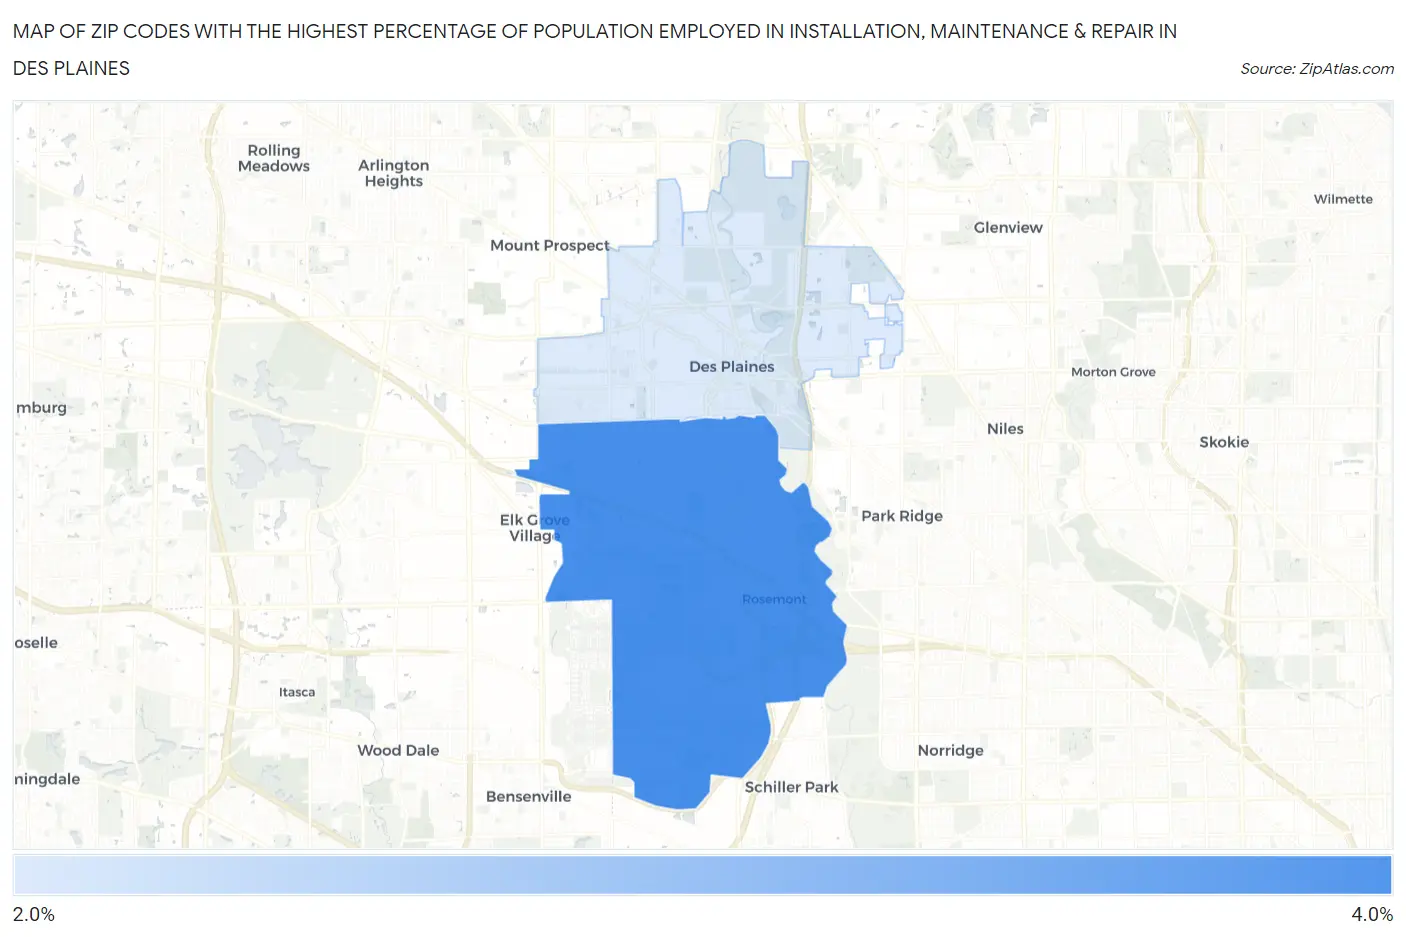
Map of Zip Codes with the Highest Percentage of Population Employed in Installation, Maintenance & Repair in Des Plaines
2.9%
3.2%
Zip Codes with the Highest Percentage of Population Employed in Installation, Maintenance & Repair in Des Plaines, IL
| Zip Code | % Employed | vs State | vs National | |
| 1. | 60018 | 3.2% | 2.7%(+0.463)#709 | 3.1%(+0.123)#16,074 |
| 2. | 60016 | 2.9% | 2.7%(+0.208)#763 | 3.1%(-0.131)#17,310 |
1
Common Questions
What are the Top Zip Codes with the Highest Percentage of Population Employed in Installation, Maintenance & Repair in Des Plaines, IL?
Top Zip Codes with the Highest Percentage of Population Employed in Installation, Maintenance & Repair in Des Plaines, IL are:
What zip code has the Highest Percentage of Population Employed in Installation, Maintenance & Repair in Des Plaines, IL?
60018 has the Highest Percentage of Population Employed in Installation, Maintenance & Repair in Des Plaines, IL with 3.2%.
What is the Percentage of Population Employed in Installation, Maintenance & Repair in Des Plaines, IL?
Percentage of Population Employed in Installation, Maintenance & Repair in Des Plaines is 3.2%.
What is the Percentage of Population Employed in Installation, Maintenance & Repair in Illinois?
Percentage of Population Employed in Installation, Maintenance & Repair in Illinois is 2.7%.
What is the Percentage of Population Employed in Installation, Maintenance & Repair in the United States?
Percentage of Population Employed in Installation, Maintenance & Repair in the United States is 3.1%.