Zip Codes with the Highest Percentage of Population Employed in Life, Physical & Social Science in Des Plaines, IL
RELATED REPORTS & OPTIONS
Life, Physical & Social Science
Des Plaines
Compare Zip Codes
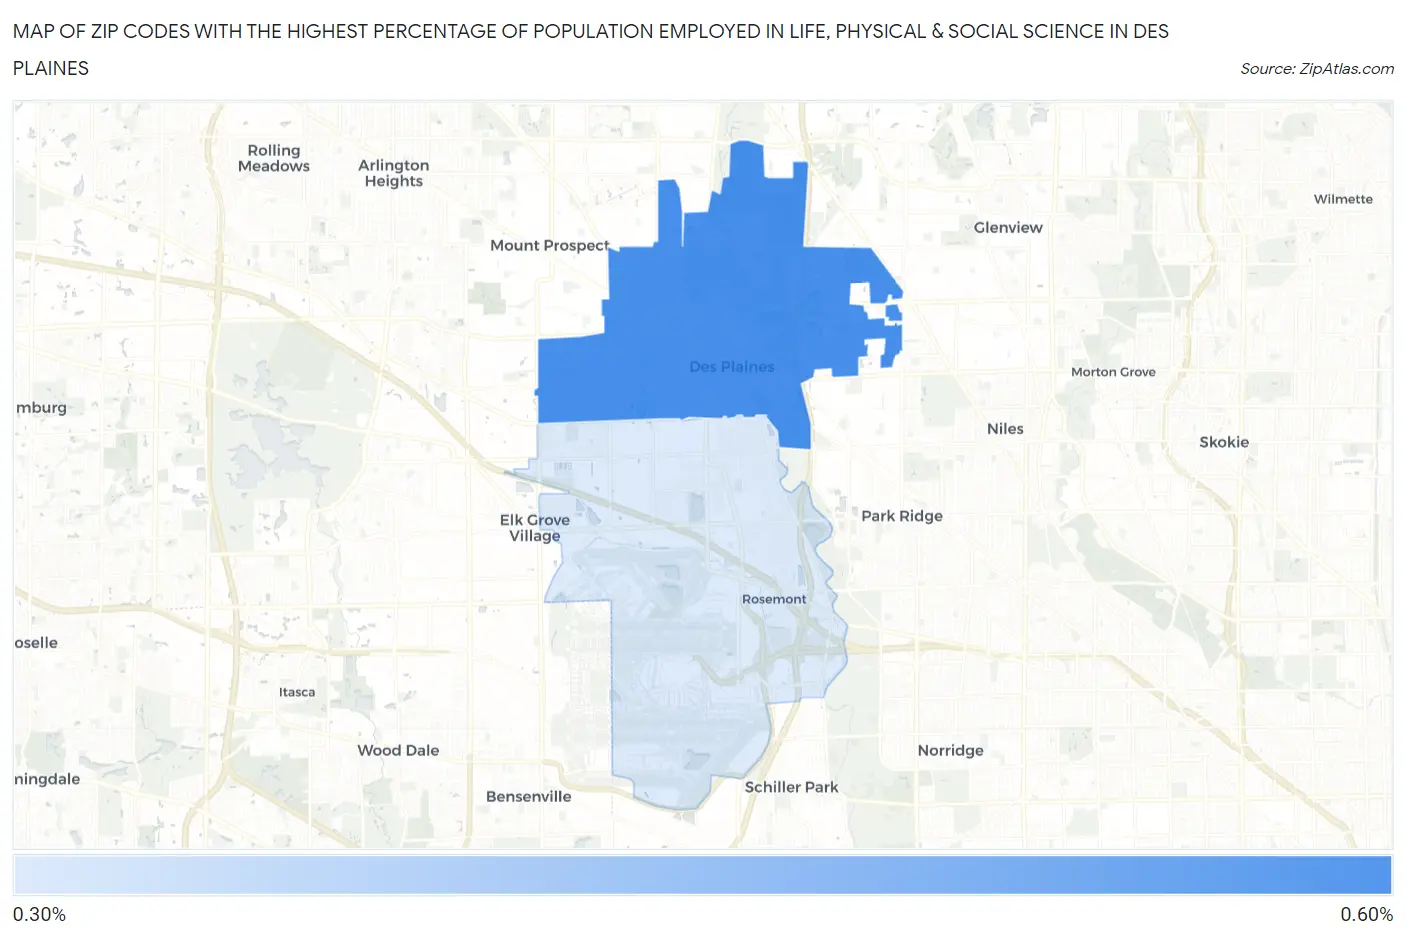
Map of Zip Codes with the Highest Percentage of Population Employed in Life, Physical & Social Science in Des Plaines
0.37%
0.56%
Zip Codes with the Highest Percentage of Population Employed in Life, Physical & Social Science in Des Plaines, IL
| Zip Code | % Employed | vs State | vs National | |
| 1. | 60016 | 0.56% | 0.98%(-0.415)#531 | 1.1%(-0.527)#13,729 |
| 2. | 60018 | 0.37% | 0.98%(-0.610)#655 | 1.1%(-0.722)#16,160 |
1
Common Questions
What are the Top Zip Codes with the Highest Percentage of Population Employed in Life, Physical & Social Science in Des Plaines, IL?
Top Zip Codes with the Highest Percentage of Population Employed in Life, Physical & Social Science in Des Plaines, IL are:
What zip code has the Highest Percentage of Population Employed in Life, Physical & Social Science in Des Plaines, IL?
60016 has the Highest Percentage of Population Employed in Life, Physical & Social Science in Des Plaines, IL with 0.56%.
What is the Percentage of Population Employed in Life, Physical & Social Science in Des Plaines, IL?
Percentage of Population Employed in Life, Physical & Social Science in Des Plaines is 0.62%.
What is the Percentage of Population Employed in Life, Physical & Social Science in Illinois?
Percentage of Population Employed in Life, Physical & Social Science in Illinois is 0.98%.
What is the Percentage of Population Employed in Life, Physical & Social Science in the United States?
Percentage of Population Employed in Life, Physical & Social Science in the United States is 1.1%.