Zip Codes with the Highest Percentage of Population Employed in Legal Services & Support in Sioux City, IA
RELATED REPORTS & OPTIONS
Legal Services & Support
Sioux City
Compare Zip Codes
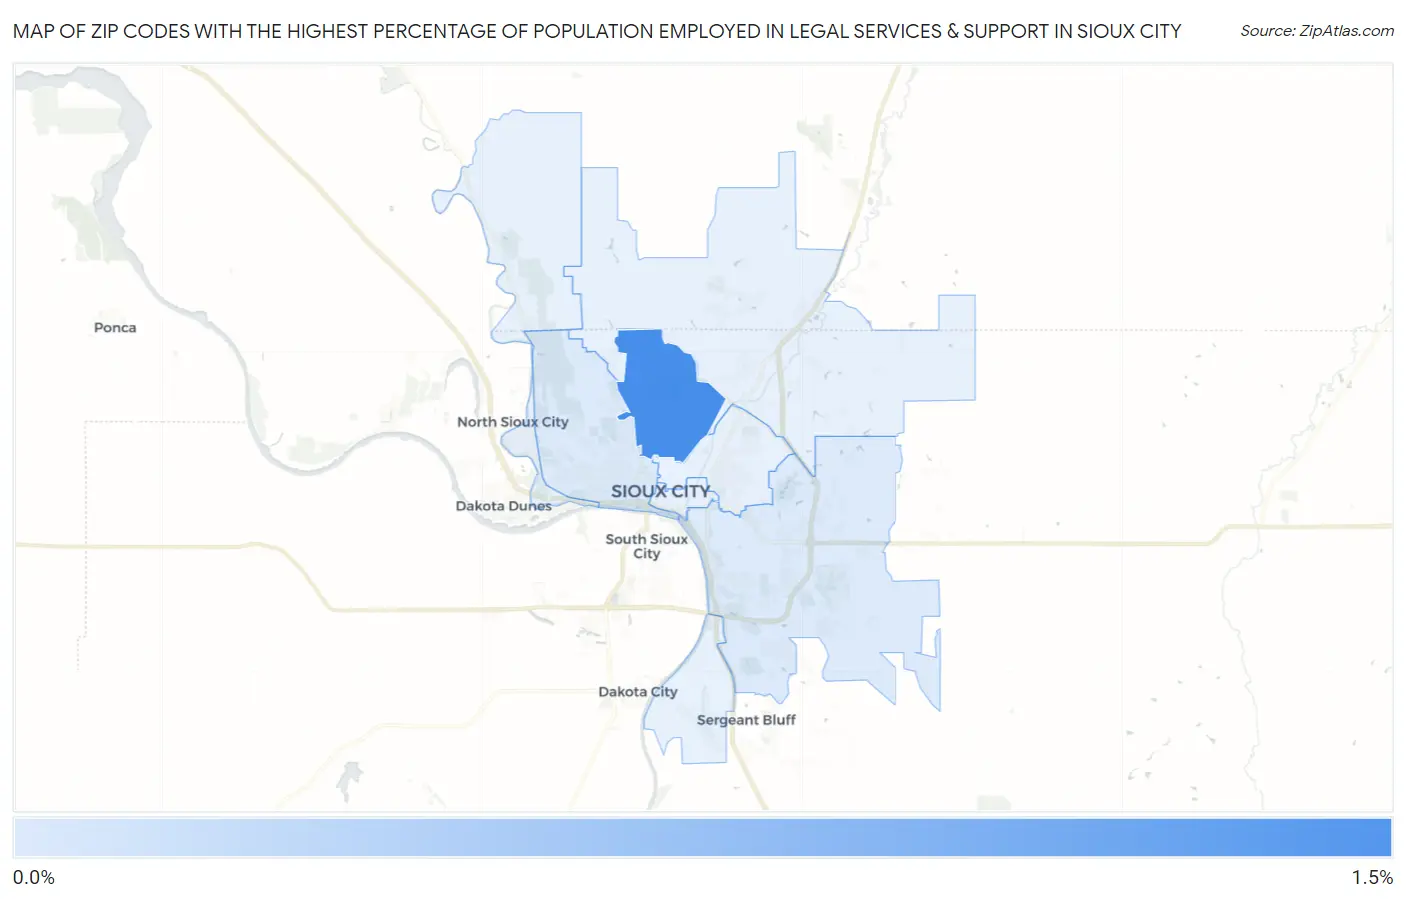
Map of Zip Codes with the Highest Percentage of Population Employed in Legal Services & Support in Sioux City
0.25%
1.0%
Zip Codes with the Highest Percentage of Population Employed in Legal Services & Support in Sioux City, IA
| Zip Code | % Employed | vs State | vs National | |
| 1. | 51104 | 1.0% | 0.75%(+0.280)#119 | 1.2%(-0.159)#7,649 |
| 2. | 51103 | 0.26% | 0.75%(-0.489)#321 | 1.2%(-0.927)#15,556 |
| 3. | 51106 | 0.25% | 0.75%(-0.492)#323 | 1.2%(-0.930)#15,588 |
1
Common Questions
What are the Top 5 Zip Codes with the Highest Percentage of Population Employed in Legal Services & Support in Sioux City, IA?
Top 5 Zip Codes with the Highest Percentage of Population Employed in Legal Services & Support in Sioux City, IA are:
What zip code has the Highest Percentage of Population Employed in Legal Services & Support in Sioux City, IA?
51104 has the Highest Percentage of Population Employed in Legal Services & Support in Sioux City, IA with 1.0%.
What is the Percentage of Population Employed in Legal Services & Support in Sioux City, IA?
Percentage of Population Employed in Legal Services & Support in Sioux City is 0.42%.
What is the Percentage of Population Employed in Legal Services & Support in Iowa?
Percentage of Population Employed in Legal Services & Support in Iowa is 0.75%.
What is the Percentage of Population Employed in Legal Services & Support in the United States?
Percentage of Population Employed in Legal Services & Support in the United States is 1.2%.