Zip Codes with the Highest Percentage of Population with a Degree in Visual and Performing Arts in Lawrenceville, GA
RELATED REPORTS & OPTIONS
Visual and Performing Arts
Lawrenceville
Compare Zip Codes
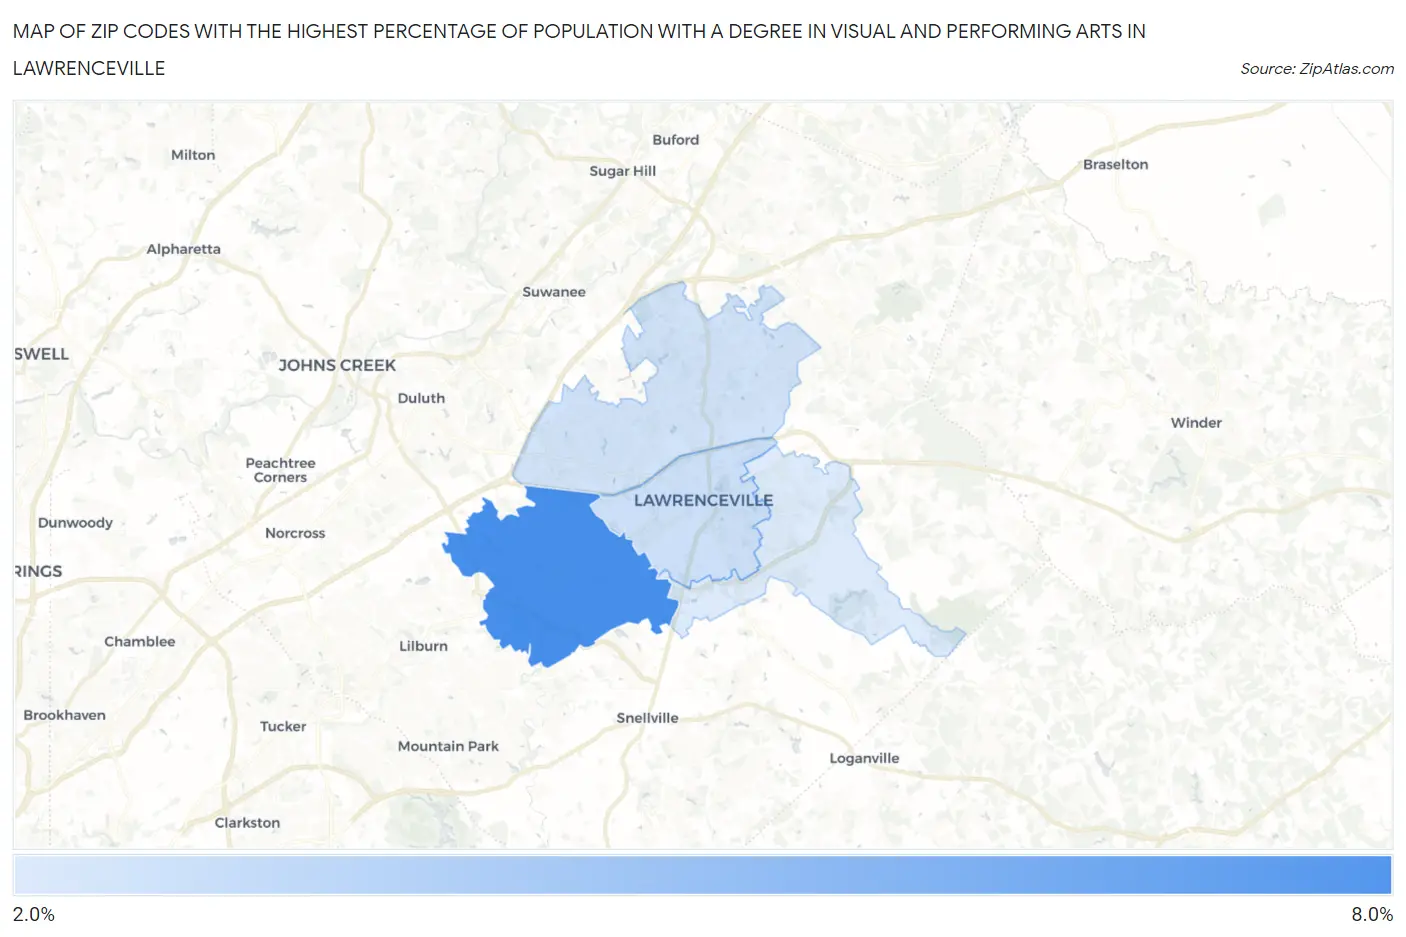
Map of Zip Codes with the Highest Percentage of Population with a Degree in Visual and Performing Arts in Lawrenceville
2.7%
6.8%
Zip Codes with the Highest Percentage of Population with a Degree in Visual and Performing Arts in Lawrenceville, GA
| Zip Code | % Graduates | vs State | vs National | |
| 1. | 30044 | 6.8% | 3.8%(+2.98)#63 | 4.3%(+2.51)#3,917 |
| 2. | 30046 | 3.1% | 3.8%(-0.674)#258 | 4.3%(-1.14)#12,286 |
| 3. | 30043 | 3.0% | 3.8%(-0.772)#268 | 4.3%(-1.23)#12,682 |
| 4. | 30045 | 2.7% | 3.8%(-1.10)#299 | 4.3%(-1.56)#13,931 |
1
Common Questions
What are the Top 3 Zip Codes with the Highest Percentage of Population with a Degree in Visual and Performing Arts in Lawrenceville, GA?
Top 3 Zip Codes with the Highest Percentage of Population with a Degree in Visual and Performing Arts in Lawrenceville, GA are:
What zip code has the Highest Percentage of Population with a Degree in Visual and Performing Arts in Lawrenceville, GA?
30044 has the Highest Percentage of Population with a Degree in Visual and Performing Arts in Lawrenceville, GA with 6.8%.
What is the Percentage of Population with a Degree in Visual and Performing Arts in Lawrenceville, GA?
Percentage of Population with a Degree in Visual and Performing Arts in Lawrenceville is 2.9%.
What is the Percentage of Population with a Degree in Visual and Performing Arts in Georgia?
Percentage of Population with a Degree in Visual and Performing Arts in Georgia is 3.8%.
What is the Percentage of Population with a Degree in Visual and Performing Arts in the United States?
Percentage of Population with a Degree in Visual and Performing Arts in the United States is 4.3%.