Zip Codes with the Highest Percentage of Population with a Degree in Visual and Performing Arts in Norcross, GA
RELATED REPORTS & OPTIONS
Visual and Performing Arts
Norcross
Compare Zip Codes
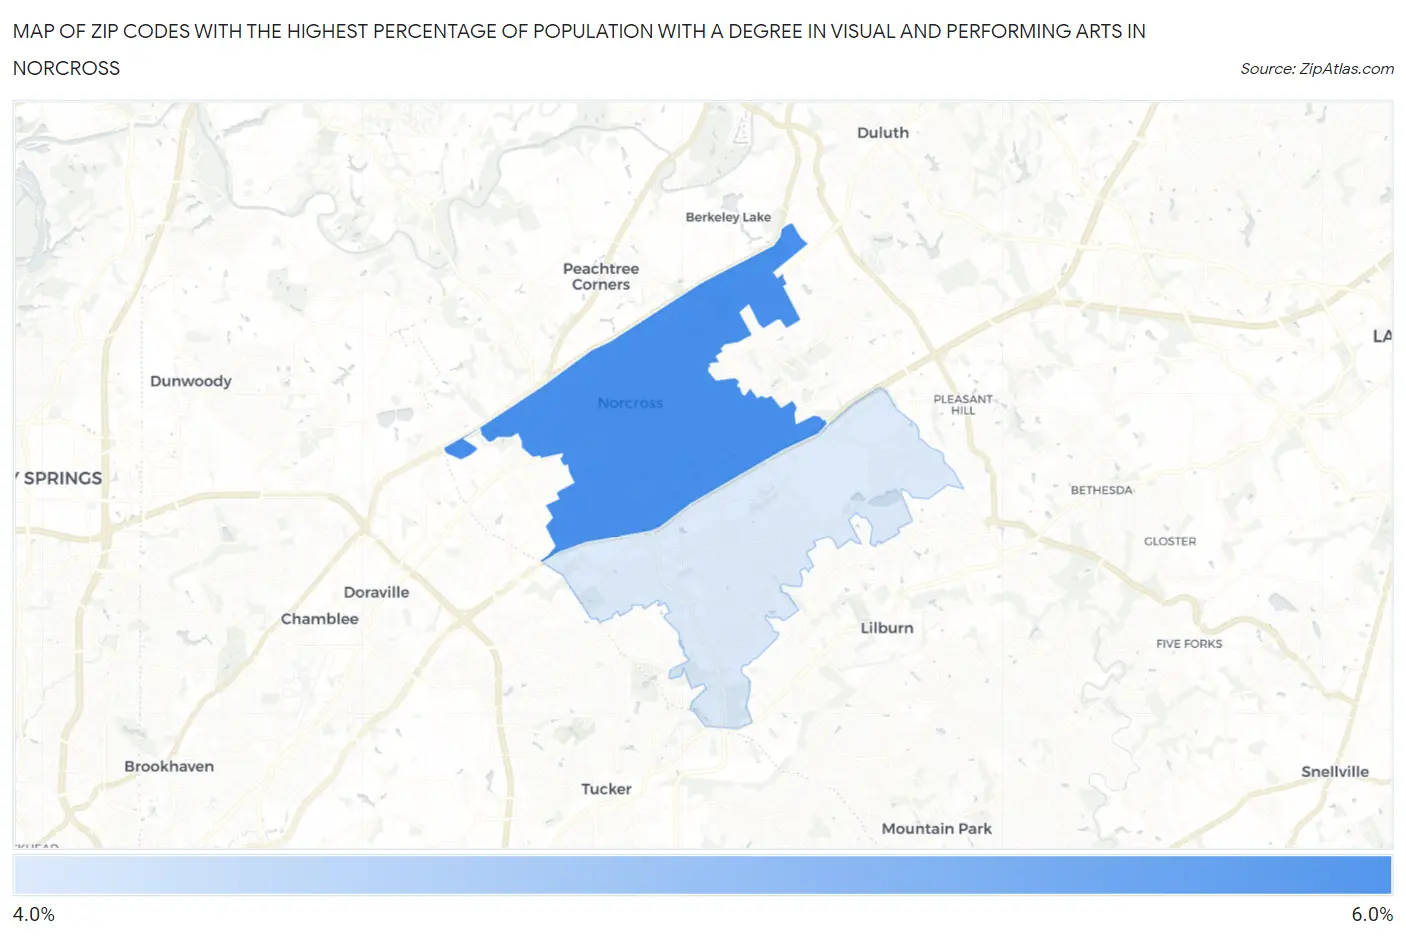
Map of Zip Codes with the Highest Percentage of Population with a Degree in Visual and Performing Arts in Norcross
4.5%
5.9%
Zip Codes with the Highest Percentage of Population with a Degree in Visual and Performing Arts in Norcross, GA
| Zip Code | % Graduates | vs State | vs National | |
| 1. | 30071 | 5.9% | 3.8%(+2.09)#91 | 4.3%(+1.63)#5,029 |
| 2. | 30093 | 4.5% | 3.8%(+0.738)#149 | 4.3%(+0.276)#7,736 |
1
Common Questions
What are the Top Zip Codes with the Highest Percentage of Population with a Degree in Visual and Performing Arts in Norcross, GA?
Top Zip Codes with the Highest Percentage of Population with a Degree in Visual and Performing Arts in Norcross, GA are:
What zip code has the Highest Percentage of Population with a Degree in Visual and Performing Arts in Norcross, GA?
30071 has the Highest Percentage of Population with a Degree in Visual and Performing Arts in Norcross, GA with 5.9%.
What is the Percentage of Population with a Degree in Visual and Performing Arts in Norcross, GA?
Percentage of Population with a Degree in Visual and Performing Arts in Norcross is 3.1%.
What is the Percentage of Population with a Degree in Visual and Performing Arts in Georgia?
Percentage of Population with a Degree in Visual and Performing Arts in Georgia is 3.8%.
What is the Percentage of Population with a Degree in Visual and Performing Arts in the United States?
Percentage of Population with a Degree in Visual and Performing Arts in the United States is 4.3%.