Zip Codes with the Highest Percentage of Population with a Degree in Visual and Performing Arts in Lithonia, GA
RELATED REPORTS & OPTIONS
Visual and Performing Arts
Lithonia
Compare Zip Codes
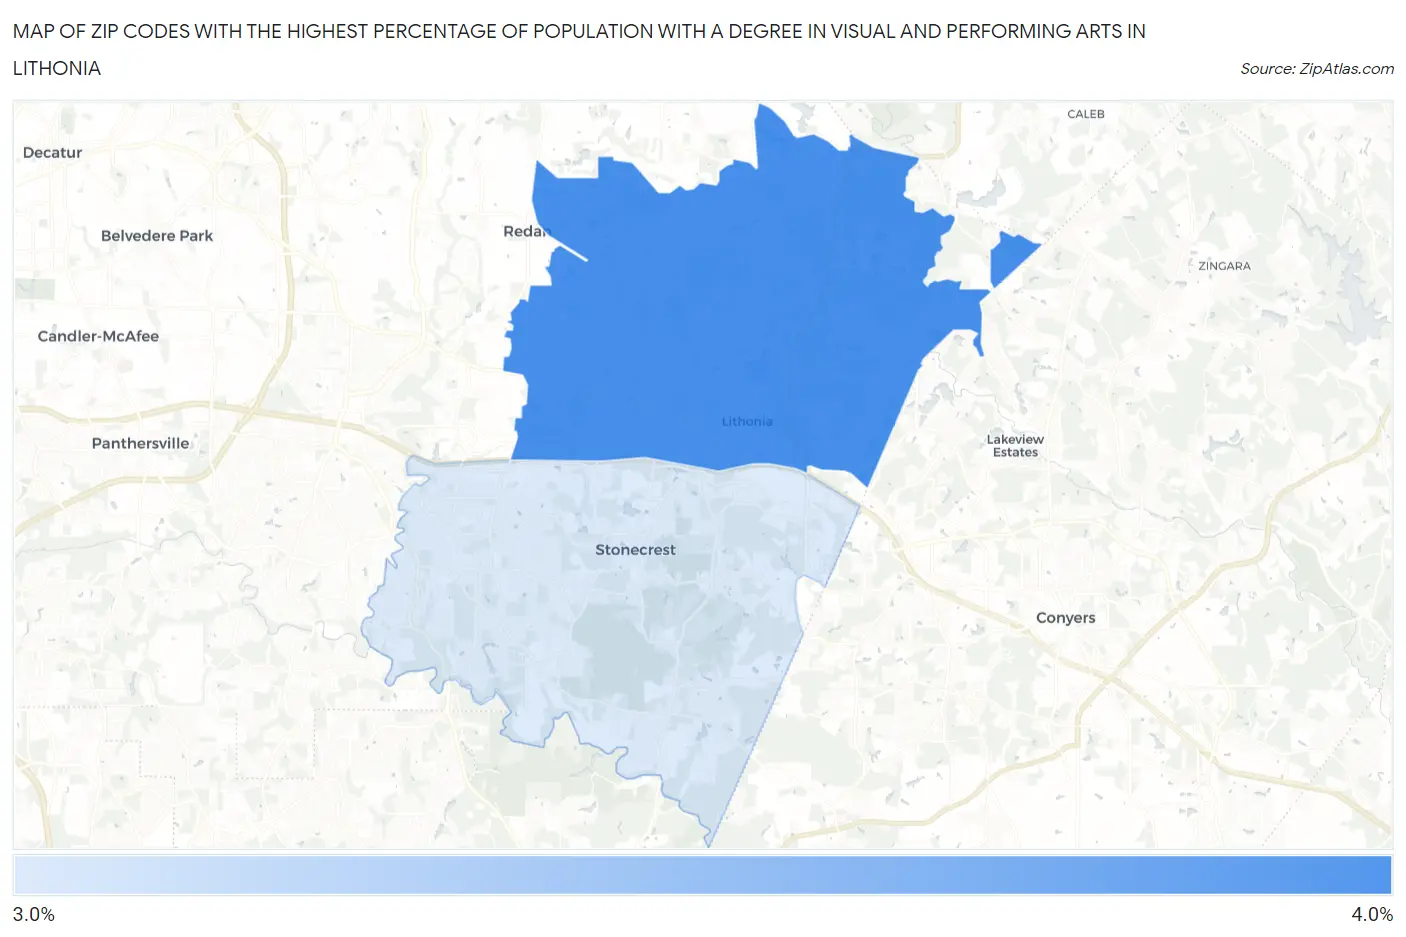
Map of Zip Codes with the Highest Percentage of Population with a Degree in Visual and Performing Arts in Lithonia
3.0%
3.6%
Zip Codes with the Highest Percentage of Population with a Degree in Visual and Performing Arts in Lithonia, GA
| Zip Code | % Graduates | vs State | vs National | |
| 1. | 30058 | 3.6% | 3.8%(-0.186)#221 | 4.3%(-0.647)#10,485 |
| 2. | 30038 | 3.0% | 3.8%(-0.785)#270 | 4.3%(-1.25)#12,714 |
1
Common Questions
What are the Top Zip Codes with the Highest Percentage of Population with a Degree in Visual and Performing Arts in Lithonia, GA?
Top Zip Codes with the Highest Percentage of Population with a Degree in Visual and Performing Arts in Lithonia, GA are:
What zip code has the Highest Percentage of Population with a Degree in Visual and Performing Arts in Lithonia, GA?
30058 has the Highest Percentage of Population with a Degree in Visual and Performing Arts in Lithonia, GA with 3.6%.
What is the Percentage of Population with a Degree in Visual and Performing Arts in Lithonia, GA?
Percentage of Population with a Degree in Visual and Performing Arts in Lithonia is 0.24%.
What is the Percentage of Population with a Degree in Visual and Performing Arts in Georgia?
Percentage of Population with a Degree in Visual and Performing Arts in Georgia is 3.8%.
What is the Percentage of Population with a Degree in Visual and Performing Arts in the United States?
Percentage of Population with a Degree in Visual and Performing Arts in the United States is 4.3%.