Zip Codes with the Highest Percentage of Population with a Degree in Visual and Performing Arts in Marietta, GA
RELATED REPORTS & OPTIONS
Visual and Performing Arts
Marietta
Compare Zip Codes
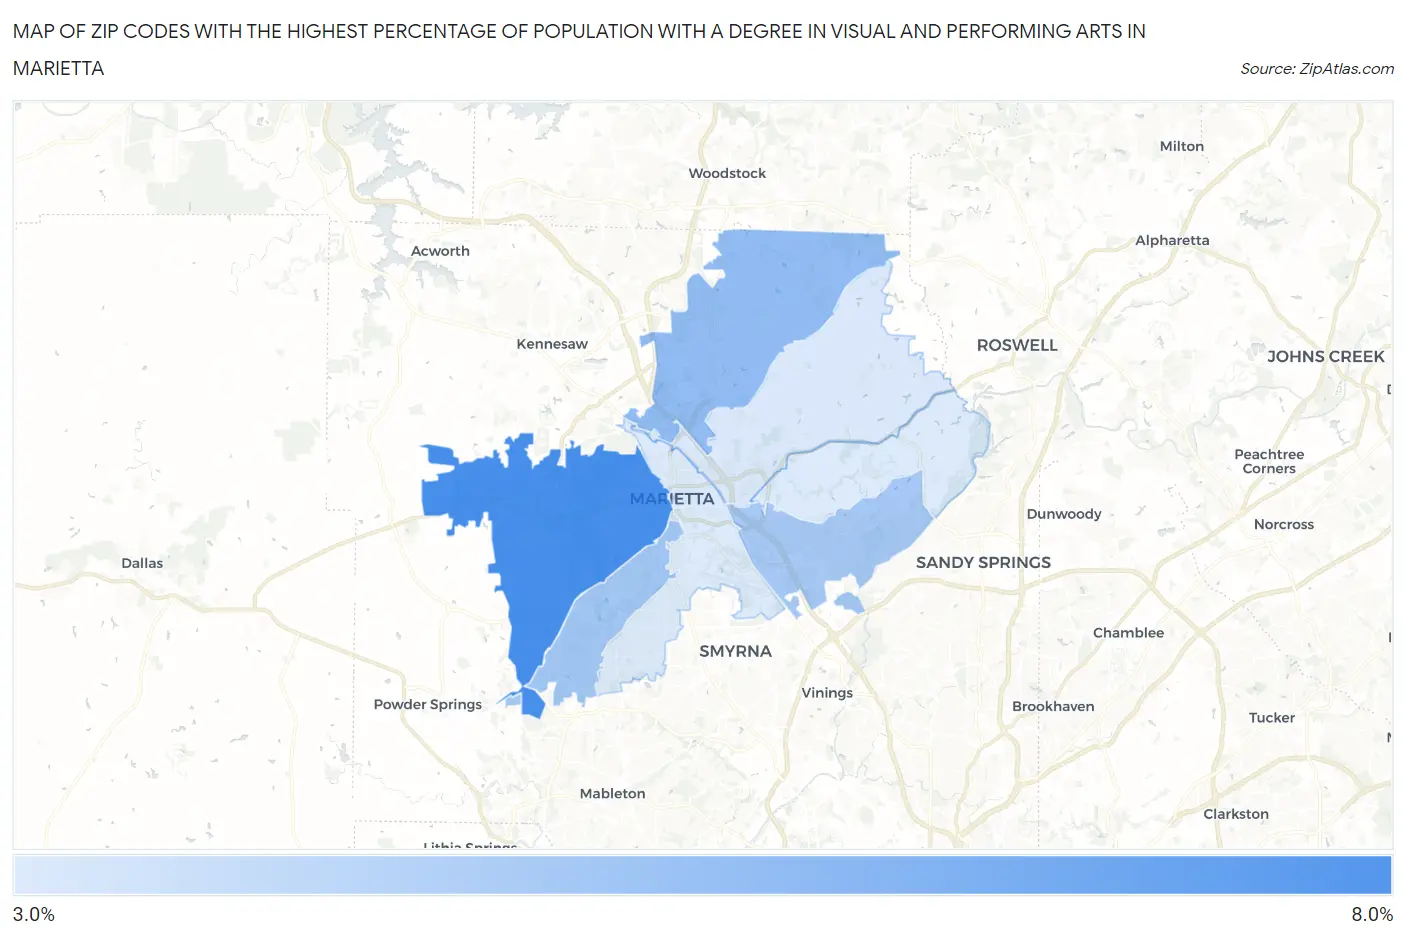
Map of Zip Codes with the Highest Percentage of Population with a Degree in Visual and Performing Arts in Marietta
3.1%
6.4%
Zip Codes with the Highest Percentage of Population with a Degree in Visual and Performing Arts in Marietta, GA
| Zip Code | % Graduates | vs State | vs National | |
| 1. | 30064 | 6.4% | 3.8%(+2.64)#72 | 4.3%(+2.18)#4,312 |
| 2. | 30066 | 4.8% | 3.8%(+1.03)#135 | 4.3%(+0.566)#7,033 |
| 3. | 30008 | 4.4% | 3.8%(+0.604)#158 | 4.3%(+0.143)#8,112 |
| 4. | 30067 | 4.4% | 3.8%(+0.578)#161 | 4.3%(+0.117)#8,170 |
| 5. | 30062 | 3.2% | 3.8%(-0.602)#252 | 4.3%(-1.06)#12,026 |
| 6. | 30068 | 3.1% | 3.8%(-0.647)#255 | 4.3%(-1.11)#12,184 |
| 7. | 30060 | 3.1% | 3.8%(-0.647)#256 | 4.3%(-1.11)#12,185 |
1
Common Questions
What are the Top 5 Zip Codes with the Highest Percentage of Population with a Degree in Visual and Performing Arts in Marietta, GA?
Top 5 Zip Codes with the Highest Percentage of Population with a Degree in Visual and Performing Arts in Marietta, GA are:
What zip code has the Highest Percentage of Population with a Degree in Visual and Performing Arts in Marietta, GA?
30064 has the Highest Percentage of Population with a Degree in Visual and Performing Arts in Marietta, GA with 6.4%.
What is the Percentage of Population with a Degree in Visual and Performing Arts in Marietta, GA?
Percentage of Population with a Degree in Visual and Performing Arts in Marietta is 4.2%.
What is the Percentage of Population with a Degree in Visual and Performing Arts in Georgia?
Percentage of Population with a Degree in Visual and Performing Arts in Georgia is 3.8%.
What is the Percentage of Population with a Degree in Visual and Performing Arts in the United States?
Percentage of Population with a Degree in Visual and Performing Arts in the United States is 4.3%.