Zip Codes with the Highest Percentage of Population with a Degree in Visual and Performing Arts in Mcdonough, GA
RELATED REPORTS & OPTIONS
Visual and Performing Arts
Mcdonough
Compare Zip Codes
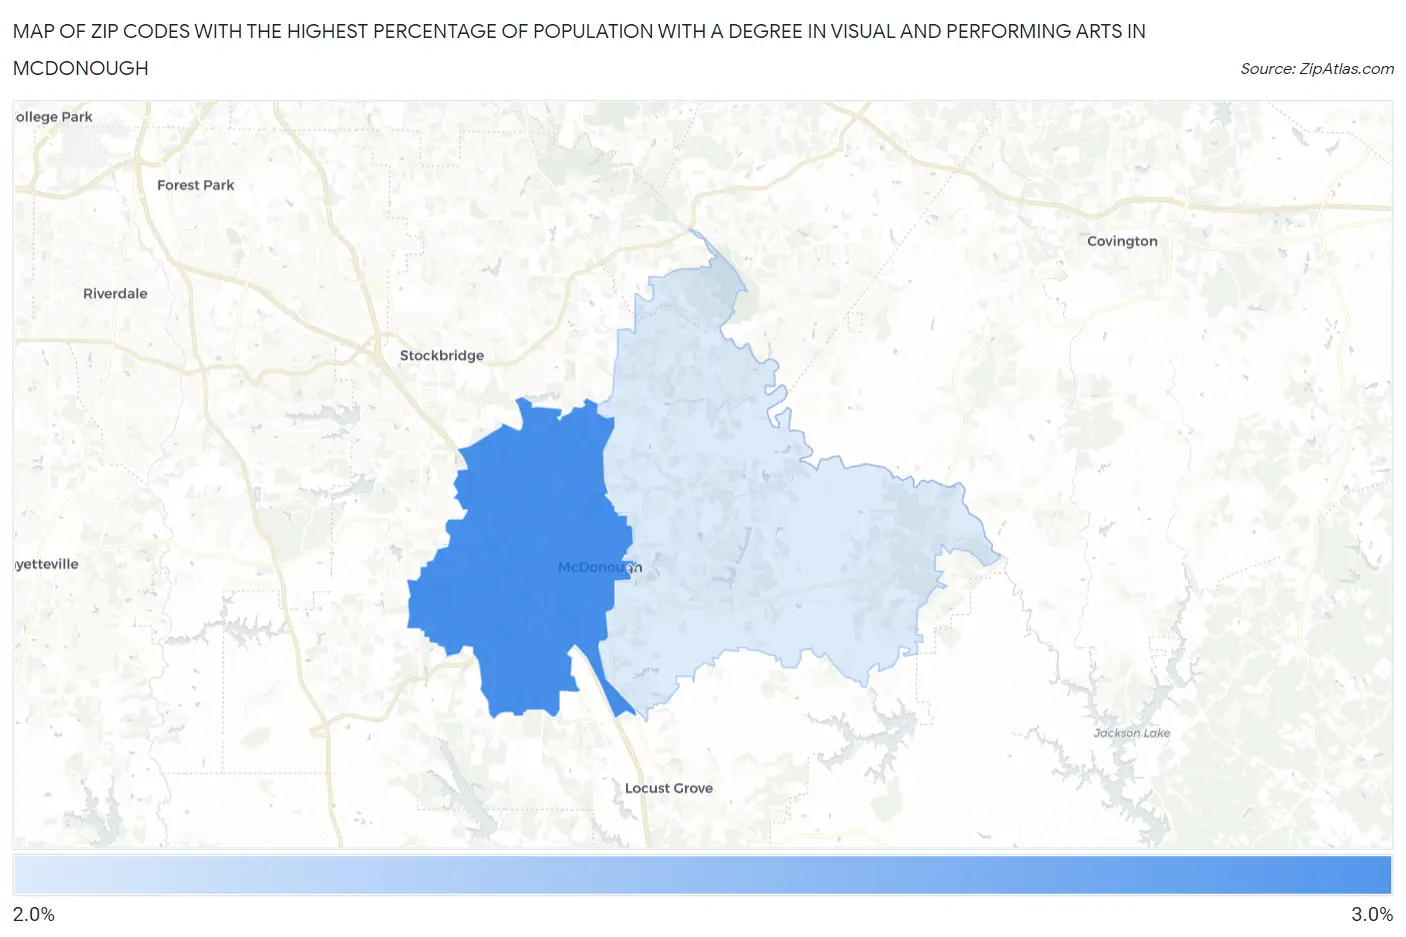
Map of Zip Codes with the Highest Percentage of Population with a Degree in Visual and Performing Arts in Mcdonough
2.5%
3.0%
Zip Codes with the Highest Percentage of Population with a Degree in Visual and Performing Arts in Mcdonough, GA
| Zip Code | % Graduates | vs State | vs National | |
| 1. | 30253 | 3.0% | 3.8%(-0.796)#271 | 4.3%(-1.26)#12,746 |
| 2. | 30252 | 2.5% | 3.8%(-1.29)#316 | 4.3%(-1.75)#14,613 |
1
Common Questions
What are the Top Zip Codes with the Highest Percentage of Population with a Degree in Visual and Performing Arts in Mcdonough, GA?
Top Zip Codes with the Highest Percentage of Population with a Degree in Visual and Performing Arts in Mcdonough, GA are:
What zip code has the Highest Percentage of Population with a Degree in Visual and Performing Arts in Mcdonough, GA?
30253 has the Highest Percentage of Population with a Degree in Visual and Performing Arts in Mcdonough, GA with 3.0%.
What is the Percentage of Population with a Degree in Visual and Performing Arts in Mcdonough, GA?
Percentage of Population with a Degree in Visual and Performing Arts in Mcdonough is 2.2%.
What is the Percentage of Population with a Degree in Visual and Performing Arts in Georgia?
Percentage of Population with a Degree in Visual and Performing Arts in Georgia is 3.8%.
What is the Percentage of Population with a Degree in Visual and Performing Arts in the United States?
Percentage of Population with a Degree in Visual and Performing Arts in the United States is 4.3%.