Zip Codes with the Highest Percentage of Population Employed in Administrative & Support Services in Marietta, GA
RELATED REPORTS & OPTIONS
Administrative & Support Services
Marietta
Compare Zip Codes
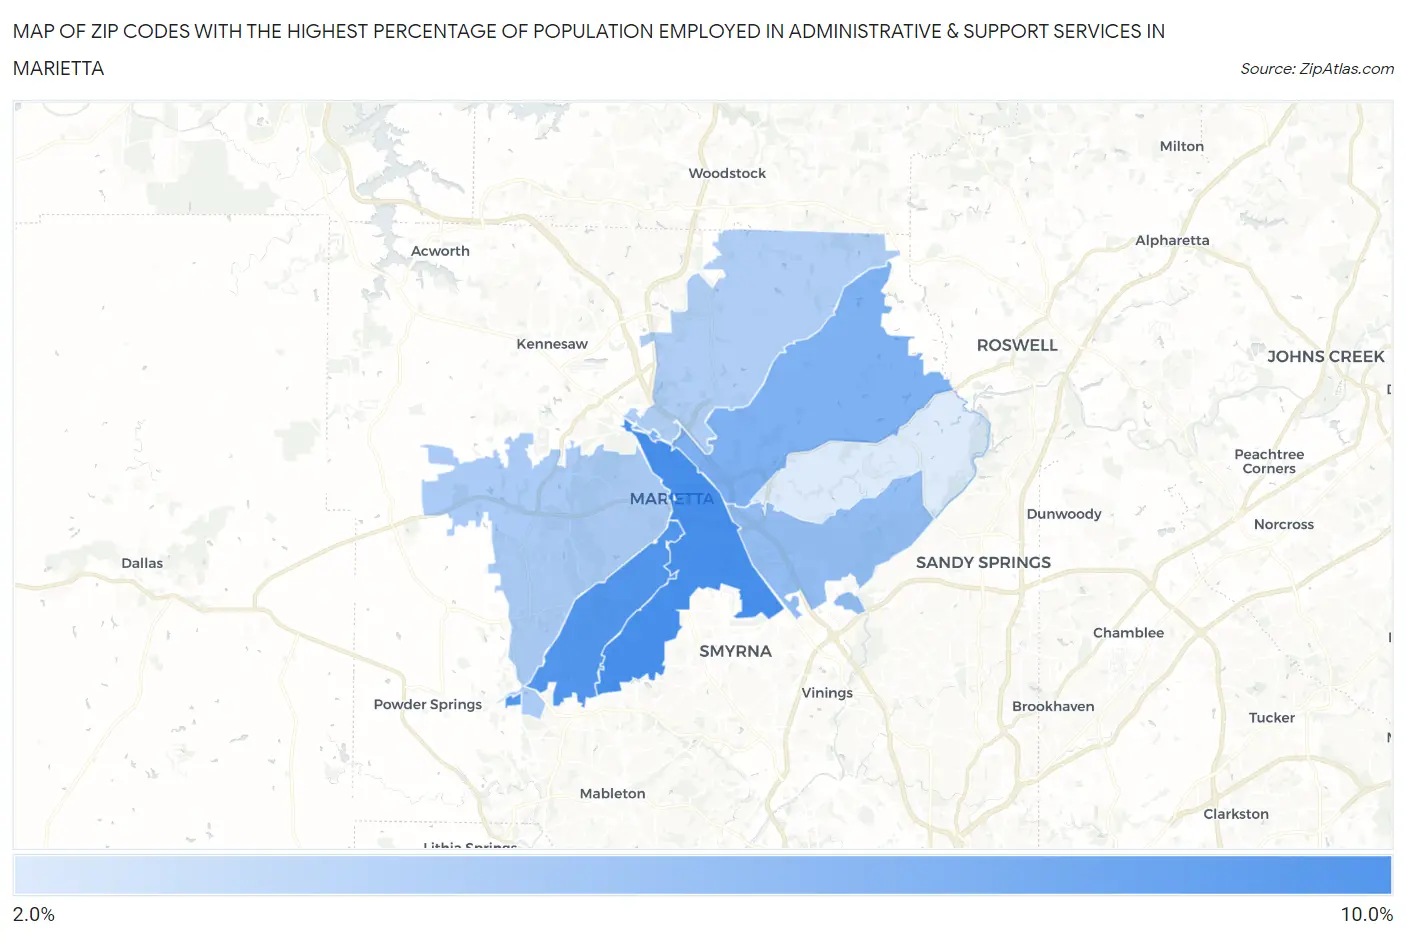
Map of Zip Codes with the Highest Percentage of Population Employed in Administrative & Support Services in Marietta
2.6%
8.4%
Zip Codes with the Highest Percentage of Population Employed in Administrative & Support Services in Marietta, GA
| Zip Code | % Employed | vs State | vs National | |
| 1. | 30060 | 8.4% | 4.8%(+3.59)#60 | 4.1%(+4.25)#2,022 |
| 2. | 30008 | 7.9% | 4.8%(+3.09)#69 | 4.1%(+3.75)#2,352 |
| 3. | 30062 | 6.2% | 4.8%(+1.41)#145 | 4.1%(+2.08)#4,358 |
| 4. | 30067 | 5.5% | 4.8%(+0.639)#192 | 4.1%(+1.31)#5,940 |
| 5. | 30064 | 4.6% | 4.8%(-0.253)#276 | 4.1%(+0.414)#8,488 |
| 6. | 30066 | 4.4% | 4.8%(-0.434)#298 | 4.1%(+0.233)#9,149 |
| 7. | 30068 | 2.6% | 4.8%(-2.20)#480 | 4.1%(-1.53)#17,494 |
1
Common Questions
What are the Top 5 Zip Codes with the Highest Percentage of Population Employed in Administrative & Support Services in Marietta, GA?
Top 5 Zip Codes with the Highest Percentage of Population Employed in Administrative & Support Services in Marietta, GA are:
What zip code has the Highest Percentage of Population Employed in Administrative & Support Services in Marietta, GA?
30060 has the Highest Percentage of Population Employed in Administrative & Support Services in Marietta, GA with 8.4%.
What is the Percentage of Population Employed in Administrative & Support Services in Marietta, GA?
Percentage of Population Employed in Administrative & Support Services in Marietta is 6.0%.
What is the Percentage of Population Employed in Administrative & Support Services in Georgia?
Percentage of Population Employed in Administrative & Support Services in Georgia is 4.8%.
What is the Percentage of Population Employed in Administrative & Support Services in the United States?
Percentage of Population Employed in Administrative & Support Services in the United States is 4.1%.