Zip Codes with the Highest Percentage of Population Employed in Accommodation & Food Services in Marietta, GA
RELATED REPORTS & OPTIONS
Accommodation & Food Services
Marietta
Compare Zip Codes
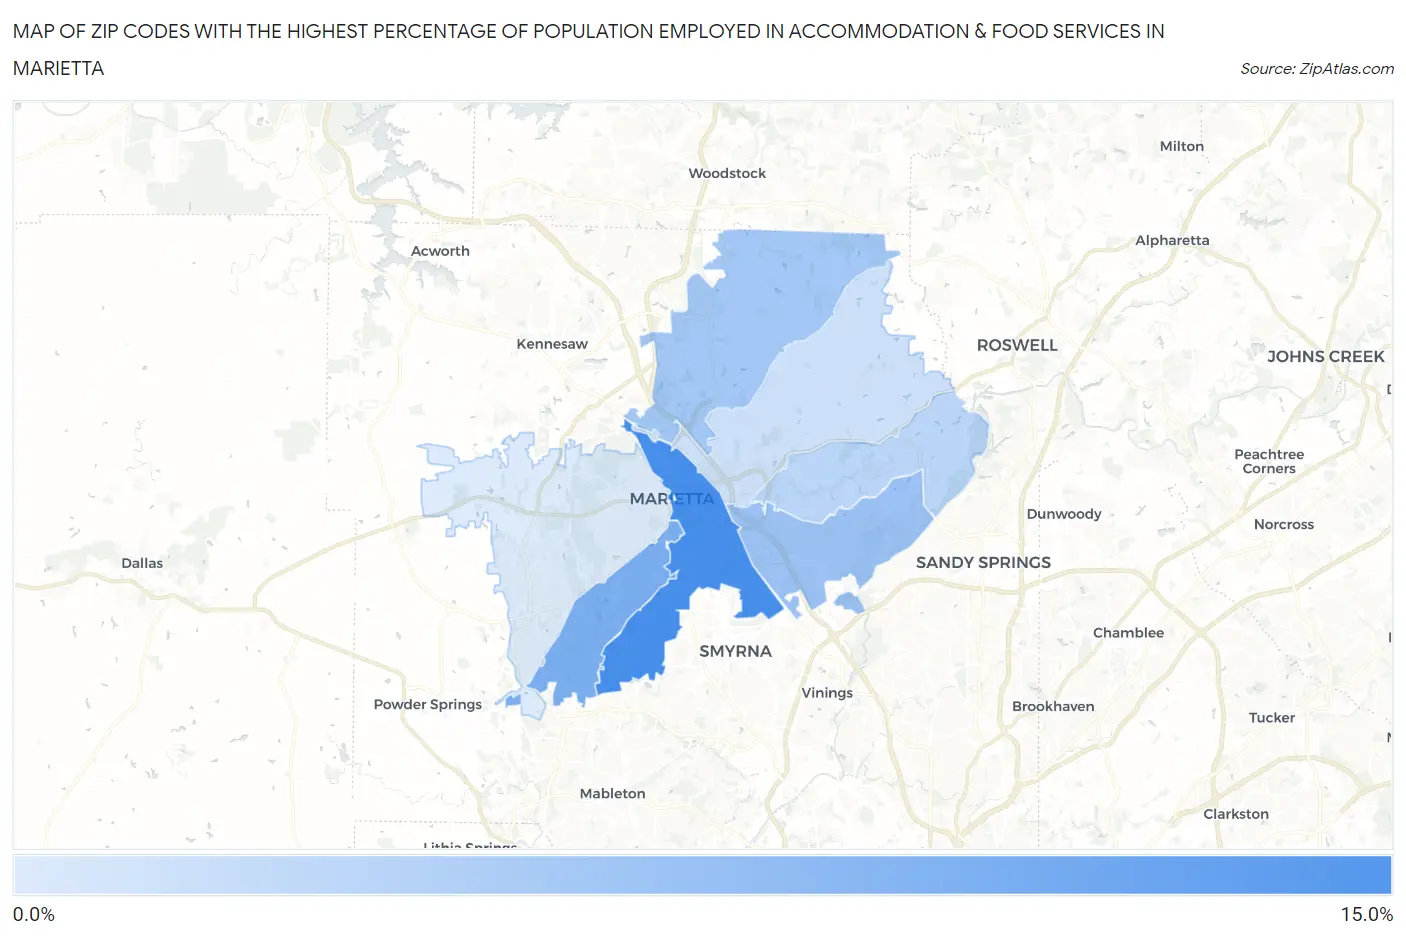
Map of Zip Codes with the Highest Percentage of Population Employed in Accommodation & Food Services in Marietta
4.6%
11.5%
Zip Codes with the Highest Percentage of Population Employed in Accommodation & Food Services in Marietta, GA
| Zip Code | % Employed | vs State | vs National | |
| 1. | 30060 | 11.5% | 7.2%(+4.33)#65 | 6.9%(+4.66)#3,136 |
| 2. | 30008 | 9.0% | 7.2%(+1.80)#143 | 6.9%(+2.12)#5,945 |
| 3. | 30067 | 7.6% | 7.2%(+0.406)#227 | 6.9%(+0.731)#8,722 |
| 4. | 30066 | 7.3% | 7.2%(+0.053)#254 | 6.9%(+0.378)#9,654 |
| 5. | 30068 | 6.1% | 7.2%(-1.07)#355 | 6.9%(-0.749)#13,023 |
| 6. | 30062 | 5.3% | 7.2%(-1.92)#413 | 6.9%(-1.59)#15,816 |
| 7. | 30064 | 4.6% | 7.2%(-2.60)#472 | 6.9%(-2.27)#18,132 |
1
Common Questions
What are the Top 5 Zip Codes with the Highest Percentage of Population Employed in Accommodation & Food Services in Marietta, GA?
Top 5 Zip Codes with the Highest Percentage of Population Employed in Accommodation & Food Services in Marietta, GA are:
What zip code has the Highest Percentage of Population Employed in Accommodation & Food Services in Marietta, GA?
30060 has the Highest Percentage of Population Employed in Accommodation & Food Services in Marietta, GA with 11.5%.
What is the Percentage of Population Employed in Accommodation & Food Services in Marietta, GA?
Percentage of Population Employed in Accommodation & Food Services in Marietta is 8.7%.
What is the Percentage of Population Employed in Accommodation & Food Services in Georgia?
Percentage of Population Employed in Accommodation & Food Services in Georgia is 7.2%.
What is the Percentage of Population Employed in Accommodation & Food Services in the United States?
Percentage of Population Employed in Accommodation & Food Services in the United States is 6.9%.