Zip Codes with the Highest Percentage of Population with a Degree in Physical and Health Sciences in Marietta, GA
RELATED REPORTS & OPTIONS
Physical and Health Sciences
Marietta
Compare Zip Codes
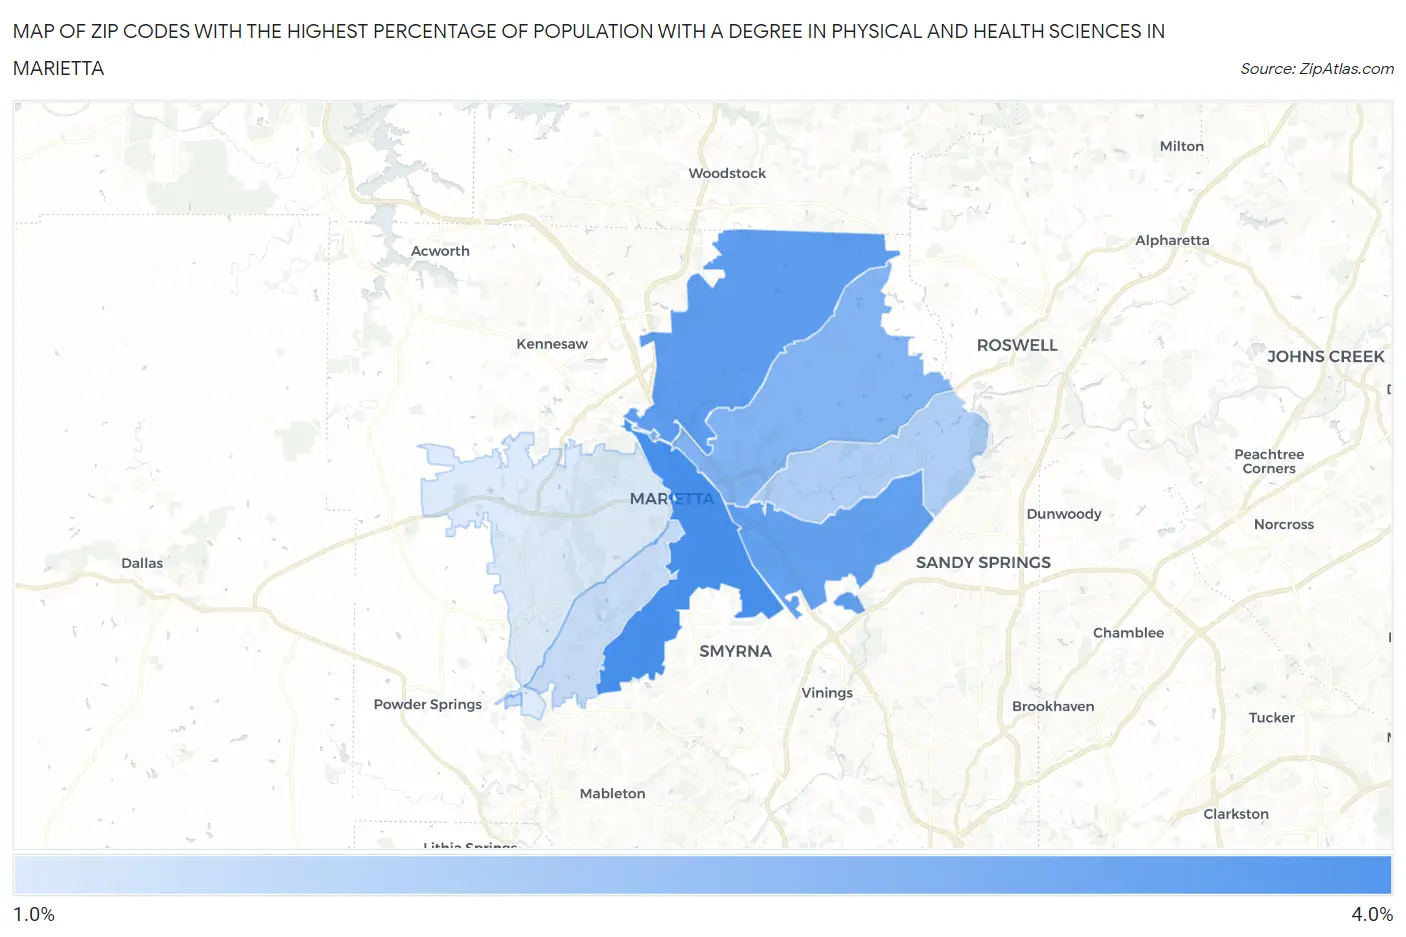
Map of Zip Codes with the Highest Percentage of Population with a Degree in Physical and Health Sciences in Marietta
1.9%
3.6%
Zip Codes with the Highest Percentage of Population with a Degree in Physical and Health Sciences in Marietta, GA
| Zip Code | % Graduates | vs State | vs National | |
| 1. | 30060 | 3.6% | 2.6%(+0.959)#137 | 3.1%(+0.454)#8,231 |
| 2. | 30066 | 3.3% | 2.6%(+0.690)#159 | 3.1%(+0.185)#9,246 |
| 3. | 30067 | 3.2% | 2.6%(+0.648)#165 | 3.1%(+0.143)#9,420 |
| 4. | 30062 | 2.9% | 2.6%(+0.321)#194 | 3.1%(-0.184)#10,791 |
| 5. | 30068 | 2.4% | 2.6%(-0.214)#263 | 3.1%(-0.719)#13,276 |
| 6. | 30008 | 2.1% | 2.6%(-0.504)#289 | 3.1%(-1.01)#14,675 |
| 7. | 30064 | 1.9% | 2.6%(-0.724)#316 | 3.1%(-1.23)#15,669 |
1
Common Questions
What are the Top 5 Zip Codes with the Highest Percentage of Population with a Degree in Physical and Health Sciences in Marietta, GA?
Top 5 Zip Codes with the Highest Percentage of Population with a Degree in Physical and Health Sciences in Marietta, GA are:
What zip code has the Highest Percentage of Population with a Degree in Physical and Health Sciences in Marietta, GA?
30060 has the Highest Percentage of Population with a Degree in Physical and Health Sciences in Marietta, GA with 3.6%.
What is the Percentage of Population with a Degree in Physical and Health Sciences in Marietta, GA?
Percentage of Population with a Degree in Physical and Health Sciences in Marietta is 2.6%.
What is the Percentage of Population with a Degree in Physical and Health Sciences in Georgia?
Percentage of Population with a Degree in Physical and Health Sciences in Georgia is 2.6%.
What is the Percentage of Population with a Degree in Physical and Health Sciences in the United States?
Percentage of Population with a Degree in Physical and Health Sciences in the United States is 3.1%.