Zip Codes with the Highest Percentage of Population Employed in Accommodation & Food Services in Griffin, GA
RELATED REPORTS & OPTIONS
Accommodation & Food Services
Griffin
Compare Zip Codes
Map of Zip Codes with the Highest Percentage of Population Employed in Accommodation & Food Services in Griffin
5.4%
6.6%
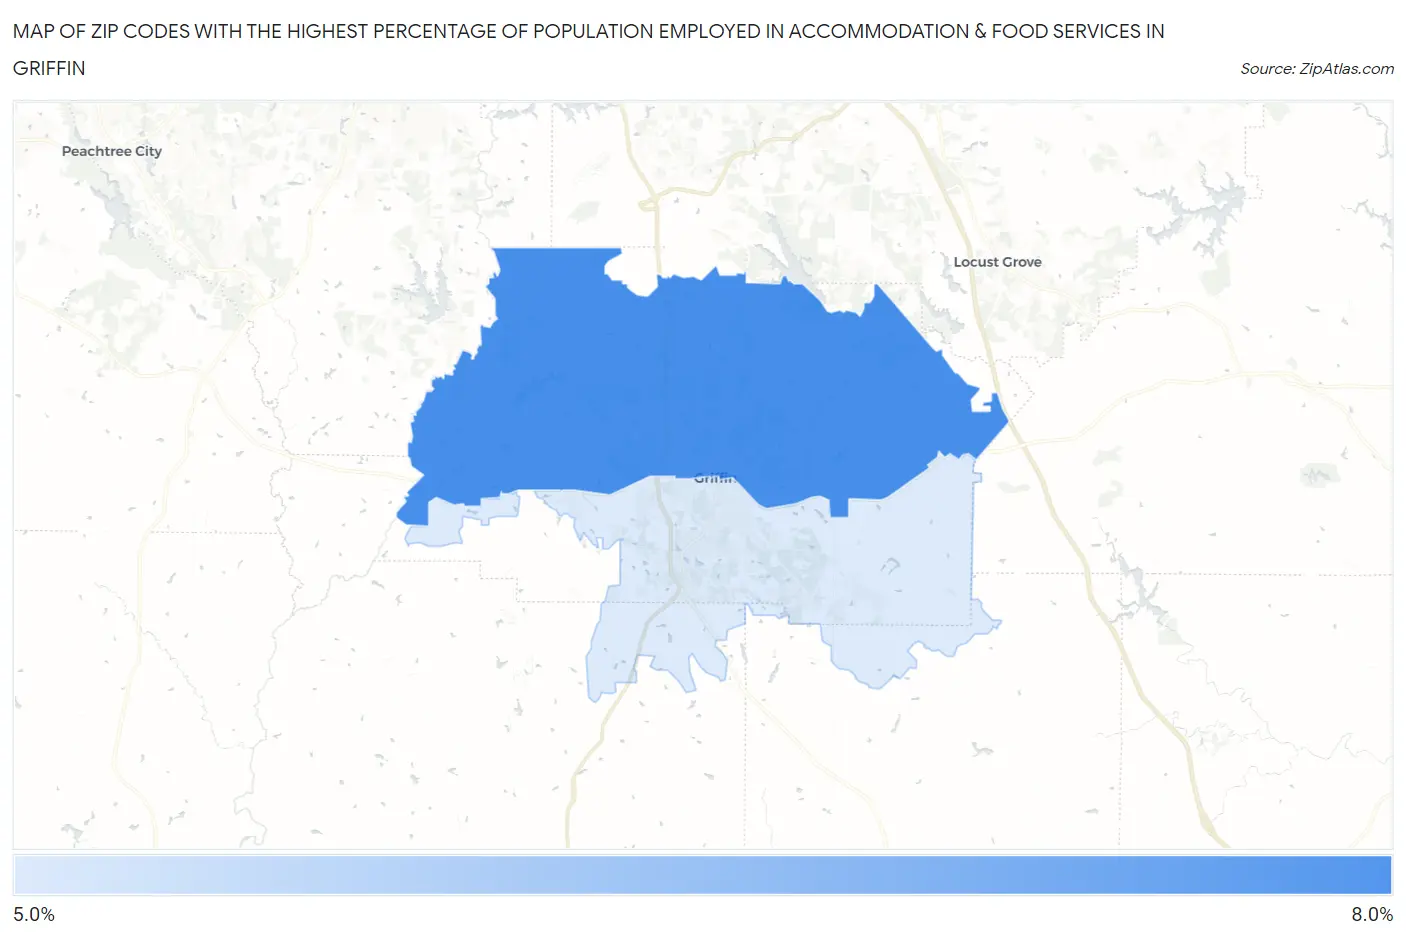
Zip Codes with the Highest Percentage of Population Employed in Accommodation & Food Services in Griffin, GA
| Zip Code | % Employed | vs State | vs National | |
| 1. | 30223 | 6.6% | 7.2%(-0.565)#308 | 6.9%(-0.240)#11,390 |
| 2. | 30224 | 5.4% | 7.2%(-1.80)#404 | 6.9%(-1.47)#15,373 |
1
Common Questions
What are the Top Zip Codes with the Highest Percentage of Population Employed in Accommodation & Food Services in Griffin, GA?
Top Zip Codes with the Highest Percentage of Population Employed in Accommodation & Food Services in Griffin, GA are:
What zip code has the Highest Percentage of Population Employed in Accommodation & Food Services in Griffin, GA?
30223 has the Highest Percentage of Population Employed in Accommodation & Food Services in Griffin, GA with 6.6%.
What is the Percentage of Population Employed in Accommodation & Food Services in Griffin, GA?
Percentage of Population Employed in Accommodation & Food Services in Griffin is 5.4%.
What is the Percentage of Population Employed in Accommodation & Food Services in Georgia?
Percentage of Population Employed in Accommodation & Food Services in Georgia is 7.2%.
What is the Percentage of Population Employed in Accommodation & Food Services in the United States?
Percentage of Population Employed in Accommodation & Food Services in the United States is 6.9%.