Spaniard vs Mexican American Indian Married-couple Households

COMPARE

Spaniard
Race
Ancestry
AfghanAfricanAlaska NativeAlaskan AthabascanAlbanianAleutAlsatianAmericanApacheArabArapahoArgentineanArmenianAssyrian/Chaldean/SyriacAustralianAustrianBahamianBangladeshiBarbadianBasqueBelgianBelizeanBermudanBhutaneseBlackfeetBolivianBrazilianBritishBritish West IndianBulgarianBurmeseCajunCambodianCanadianCape VerdeanCarpatho RusynCelticCentral AmericanCentral American IndianCherokeeCheyenneChickasawChileanChineseChippewaChoctawColombianColvilleComancheCosta RicanCreeCreekCroatianCrowCubanCypriotCzechCzechoslovakianDanishDelawareDominicanDutchDutch West IndianEastern EuropeanEcuadorianEgyptianEnglishEstonianEthiopianEuropeanFijianFilipinoFinnishFrenchFrench American IndianFrench CanadianGermanGerman RussianGhanaianGreekGuamanian/ChamorroGuatemalanGuyaneseHaitianHmongHonduranHopiHoumaHungarianIcelanderIndian (Asian)IndonesianInupiatIranianIraqiIrishIroquoisIsraeliItalianJamaicanJapaneseJordanianKenyanKiowaKoreanLaotianLatvianLebaneseLiberianLithuanianLumbeeLuxembourgerMacedonianMalaysianMalteseMarshalleseMenomineeMexicanMongolianMoroccanNative HawaiianNavajoNepaleseNew ZealanderNicaraguanNigerianNorthern EuropeanNorwegianOkinawanOsageOttawaPaiutePakistaniPalestinianPanamanianParaguayanPennsylvania GermanPeruvianPimaPolishPortuguesePotawatomiPuebloPuerto RicanPuget Sound SalishRomanianRussianSalvadoranSamoanScandinavianScotch-IrishScottishSeminoleSenegaleseSerbianShoshoneSierra LeoneanSiouxSlavicSlovakSloveneSomaliSouth AfricanSouth AmericanSouth American IndianSoviet UnionSpaniardSpanishSpanish AmericanSpanish American IndianSri LankanSubsaharan AfricanSudaneseSwedishSwissSyrianTaiwaneseThaiTlingit-HaidaTohono O'OdhamTonganTrinidadian and TobagonianTsimshianTurkishU.S. Virgin IslanderUgandanUkrainianUruguayanUteVenezuelanVietnameseWelshWest IndianYakamaYaquiYugoslavianYumanYup'ikZimbabwean
Immigration
NonimmigrantsImmigrantsAfghanistanAfricaAlbaniaArgentinaArmeniaAsiaAustraliaAustriaBahamasBangladeshBarbadosBelarusBelgiumBelizeBoliviaBosnia and HerzegovinaBrazilBulgariaBurma/MyanmarCabo VerdeCambodiaCameroonCanadaCaribbeanCentral AmericaChileChinaColombiaCongoCosta RicaCroatiaCubaCzechoslovakiaDenmarkDominicaDominican RepublicEastern AfricaEastern AsiaEastern EuropeEcuadorEgyptEl SalvadorEnglandEritreaEthiopiaEuropeFijiFranceGermanyGhanaGreeceGrenadaGuatemalaGuyanaHaitiHondurasHong KongHungaryIndiaIndonesiaIranIraqIrelandIsraelItalyJamaicaJapanJordanKazakhstanKenyaKoreaKuwaitLaosLatin AmericaLatviaLebanonLiberiaLithuaniaMalaysiaMexicoMicronesiaMiddle AfricaMoldovaMoroccoNepalNetherlandsNicaraguaNigeriaNorth AmericaNorth MacedoniaNorthern AfricaNorthern EuropeNorwayOceaniaPakistanPanamaPeruPhilippinesPolandPortugalRomaniaRussiaSaudi ArabiaScotlandSenegalSerbiaSierra LeoneSingaporeSomaliaSouth AfricaSouth AmericaSouth Central AsiaSouth Eastern AsiaSouthern EuropeSpainSri LankaSt. Vincent and the GrenadinesSudanSwedenSwitzerlandSyriaTaiwanThailandTrinidad and TobagoTurkeyUgandaUkraineUruguayUzbekistanVenezuelaVietnamWest IndiesWestern AfricaWestern AsiaWestern EuropeYemenZaireZimbabweAzores
Mexican American Indian
Race
Ancestry
AfghanAfricanAlaska NativeAlaskan AthabascanAlbanianAleutAlsatianAmericanApacheArabArapahoArgentineanArmenianAssyrian/Chaldean/SyriacAustralianAustrianBahamianBangladeshiBarbadianBasqueBelgianBelizeanBermudanBhutaneseBlackfeetBolivianBrazilianBritishBritish West IndianBulgarianBurmeseCajunCambodianCanadianCape VerdeanCarpatho RusynCelticCentral AmericanCentral American IndianCherokeeCheyenneChickasawChileanChineseChippewaChoctawColombianColvilleComancheCosta RicanCreeCreekCroatianCrowCubanCypriotCzechCzechoslovakianDanishDelawareDominicanDutchDutch West IndianEastern EuropeanEcuadorianEgyptianEnglishEstonianEthiopianEuropeanFijianFilipinoFinnishFrenchFrench American IndianFrench CanadianGermanGerman RussianGhanaianGreekGuamanian/ChamorroGuatemalanGuyaneseHaitianHmongHonduranHopiHoumaHungarianIcelanderIndian (Asian)IndonesianInupiatIranianIraqiIrishIroquoisIsraeliItalianJamaicanJapaneseJordanianKenyanKiowaKoreanLaotianLatvianLebaneseLiberianLithuanianLumbeeLuxembourgerMacedonianMalaysianMalteseMarshalleseMenomineeMexicanMexican American IndianMongolianMoroccanNative HawaiianNavajoNepaleseNew ZealanderNicaraguanNigerianNorthern EuropeanNorwegianOkinawanOsageOttawaPaiutePakistaniPalestinianPanamanianParaguayanPennsylvania GermanPeruvianPimaPolishPortuguesePotawatomiPuebloPuerto RicanPuget Sound SalishRomanianRussianSalvadoranSamoanScandinavianScotch-IrishScottishSeminoleSenegaleseSerbianShoshoneSierra LeoneanSiouxSlavicSlovakSloveneSomaliSouth AfricanSouth AmericanSouth American IndianSoviet UnionSpanishSpanish AmericanSpanish American IndianSri LankanSubsaharan AfricanSudaneseSwedishSwissSyrianTaiwaneseThaiTlingit-HaidaTohono O'OdhamTonganTrinidadian and TobagonianTsimshianTurkishU.S. Virgin IslanderUgandanUkrainianUruguayanUteVenezuelanVietnameseWelshWest IndianYakamaYaquiYugoslavianYumanYup'ikZimbabwean
Immigration
NonimmigrantsImmigrantsAfghanistanAfricaAlbaniaArgentinaArmeniaAsiaAustraliaAustriaBahamasBangladeshBarbadosBelarusBelgiumBelizeBoliviaBosnia and HerzegovinaBrazilBulgariaBurma/MyanmarCabo VerdeCambodiaCameroonCanadaCaribbeanCentral AmericaChileChinaColombiaCongoCosta RicaCroatiaCubaCzechoslovakiaDenmarkDominicaDominican RepublicEastern AfricaEastern AsiaEastern EuropeEcuadorEgyptEl SalvadorEnglandEritreaEthiopiaEuropeFijiFranceGermanyGhanaGreeceGrenadaGuatemalaGuyanaHaitiHondurasHong KongHungaryIndiaIndonesiaIranIraqIrelandIsraelItalyJamaicaJapanJordanKazakhstanKenyaKoreaKuwaitLaosLatin AmericaLatviaLebanonLiberiaLithuaniaMalaysiaMexicoMicronesiaMiddle AfricaMoldovaMoroccoNepalNetherlandsNicaraguaNigeriaNorth AmericaNorth MacedoniaNorthern AfricaNorthern EuropeNorwayOceaniaPakistanPanamaPeruPhilippinesPolandPortugalRomaniaRussiaSaudi ArabiaScotlandSenegalSerbiaSierra LeoneSingaporeSomaliaSouth AfricaSouth AmericaSouth Central AsiaSouth Eastern AsiaSouthern EuropeSpainSri LankaSt. Vincent and the GrenadinesSudanSwedenSwitzerlandSyriaTaiwanThailandTrinidad and TobagoTurkeyUgandaUkraineUruguayUzbekistanVenezuelaVietnamWest IndiesWestern AfricaWestern AsiaWestern EuropeYemenZaireZimbabweAzores
Married-couple Households
Income
Poverty
Unemployment
Labor Participation
Family Structure
Vehicle Availability
Education Level
Disability

Married-couple Households Comparison

Spaniards

Mexican American Indians

Excellent
Fair
47.2%
MARRIED-COUPLE HOUSEHOLDS
84.1/ 100
METRIC RATING
142nd/ 347
METRIC RANK
45.9%
MARRIED-COUPLE HOUSEHOLDS
23.3/ 100
METRIC RATING
194th/ 347
METRIC RANK

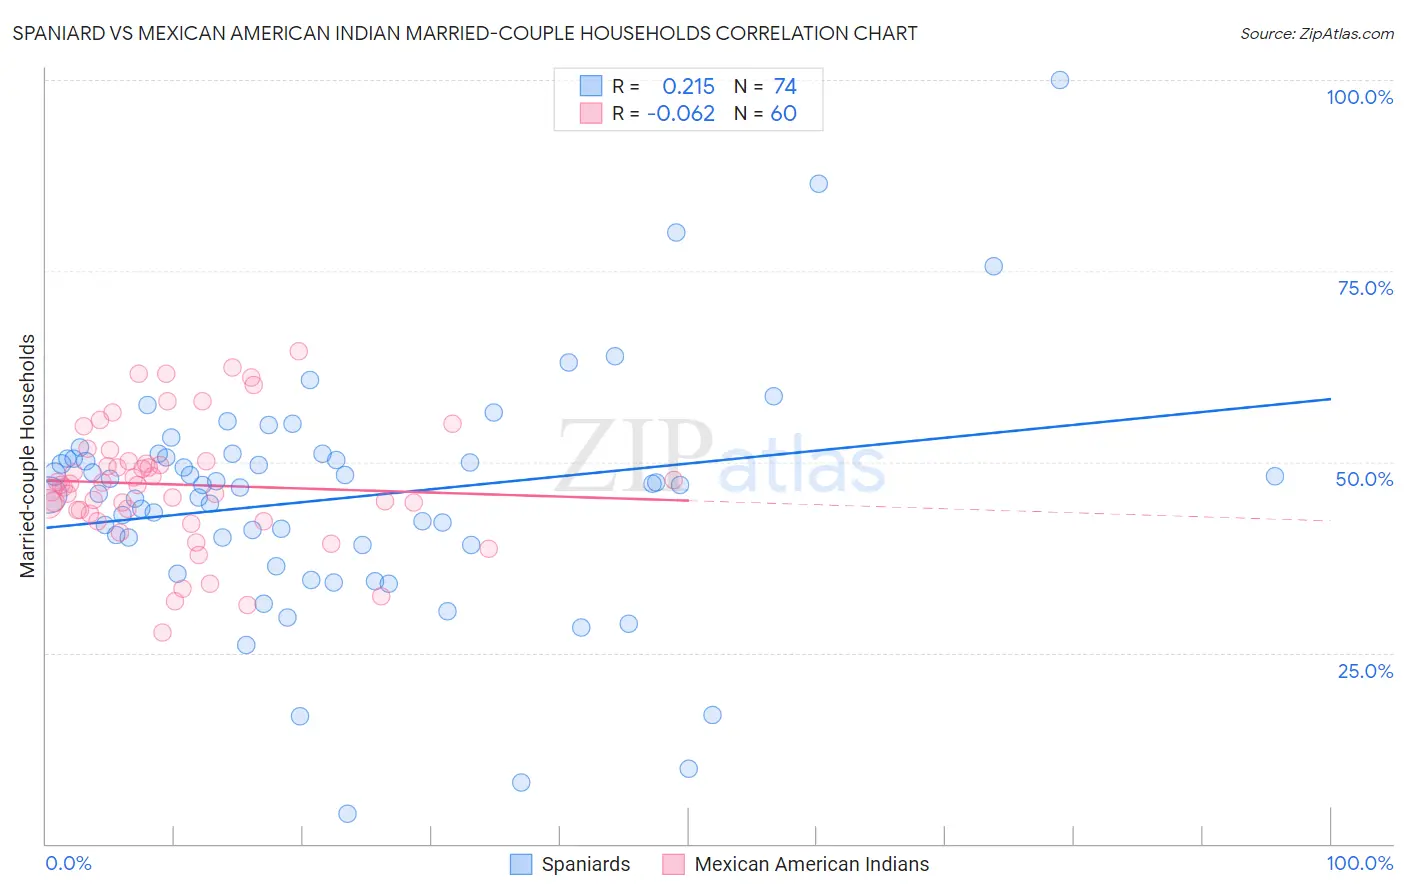
Spaniard vs Mexican American Indian Married-couple Households Correlation Chart

The statistical analysis conducted on geographies consisting of 443,146,700 people shows a weak positive correlation between the proportion of Spaniards and percentage of married-couple family households in the United States with a correlation coefficient (R) of 0.215 and weighted average of 47.2%. Similarly, the statistical analysis conducted on geographies consisting of 317,492,406 people shows a slight negative correlation between the proportion of Mexican American Indians and percentage of married-couple family households in the United States with a correlation coefficient (R) of -0.062 and weighted average of 45.9%, a difference of 2.7%.
Spaniard vs Mexican American Indian Married-couple Households

Married-couple Households Correlation Summary

MeasurementSpaniardMexican American Indian
Minimum4.0%27.7%
Maximum100.0%64.5%
Range96.0%36.8%
Mean45.3%47.0%
Median47.0%47.0%
Interquartile 25% (IQ1)39.1%43.4%
Interquartile 75% (IQ3)50.6%50.1%
Interquartile Range (IQR)11.4%6.7%
Standard Deviation (Sample)15.4%8.1%
Standard Deviation (Population)15.3%8.0%

Similar Demographics by Married-couple Households

Demographics Similar to Spaniards by Married-couple Households

In terms of married-couple households, the demographic groups most similar to Spaniards are Spanish (47.2%, a difference of 0.020%), Costa Rican (47.2%, a difference of 0.020%), Immigrants from Belarus (47.2%, a difference of 0.020%), Immigrants from Sweden (47.2%, a difference of 0.040%), and Mexican (47.1%, a difference of 0.050%).
DemographicsRating | RankMarried-couple Households
Immigrants | Argentina
86.0
/100
|
#135
Excellent
47.2%
New Zealanders
85.3
/100
|
#136
Excellent
47.2%
Immigrants | Malaysia
85.2
/100
|
#137
Excellent
47.2%
Immigrants | Afghanistan
85.1
/100
|
#138
Excellent
47.2%
Immigrants | Sweden
84.7
/100
|
#139
Excellent
47.2%
Spanish
84.5
/100
|
#140
Excellent
47.2%
Costa Ricans
84.4
/100
|
#141
Excellent
47.2%
Spaniards
84.1
/100
|
#142
Excellent
47.2%
Immigrants | Belarus
83.8
/100
|
#143
Excellent
47.2%
Mexicans
83.4
/100
|
#144
Excellent
47.1%
Slovenes
81.7
/100
|
#145
Excellent
47.1%
Immigrants | Western Europe
81.6
/100
|
#146
Excellent
47.1%
Immigrants | Syria
81.6
/100
|
#147
Excellent
47.1%
Icelanders
79.5
/100
|
#148
Good
47.0%
Paraguayans
78.7
/100
|
#149
Good
47.0%

Demographics Similar to Mexican American Indians by Married-couple Households

In terms of married-couple households, the demographic groups most similar to Mexican American Indians are Taiwanese (45.9%, a difference of 0.010%), Chickasaw (45.9%, a difference of 0.030%), Immigrants from South America (45.9%, a difference of 0.060%), Immigrants from Northern Africa (46.0%, a difference of 0.070%), and Choctaw (46.0%, a difference of 0.080%).
DemographicsRating | RankMarried-couple Households
Fijians
29.2
/100
|
#187
Fair
46.1%
South American Indians
28.4
/100
|
#188
Fair
46.0%
Immigrants | Latvia
26.9
/100
|
#189
Fair
46.0%
Immigrants | Kuwait
25.6
/100
|
#190
Fair
46.0%
Choctaw
24.9
/100
|
#191
Fair
46.0%
Immigrants | Northern Africa
24.6
/100
|
#192
Fair
46.0%
Taiwanese
23.4
/100
|
#193
Fair
45.9%
Mexican American Indians
23.3
/100
|
#194
Fair
45.9%
Chickasaw
22.7
/100
|
#195
Fair
45.9%
Immigrants | South America
22.2
/100
|
#196
Fair
45.9%
Cambodians
21.3
/100
|
#197
Fair
45.9%
Ottawa
19.4
/100
|
#198
Poor
45.8%
Carpatho Rusyns
15.7
/100
|
#199
Poor
45.7%
Potawatomi
15.6
/100
|
#200
Poor
45.7%
Immigrants | Serbia
15.2
/100
|
#201
Poor
45.7%