Spaniard vs Mexican American Indian Single Father Households
COMPARE
Spaniard
Mexican American Indian
Single Father Households
Single Father Households Comparison
Spaniards
Mexican American Indians
2.5%
SINGLE FATHER HOUSEHOLDS
3.1/ 100
METRIC RATING
243rd/ 347
METRIC RANK
2.8%
SINGLE FATHER HOUSEHOLDS
0.0/ 100
METRIC RATING
304th/ 347
METRIC RANK
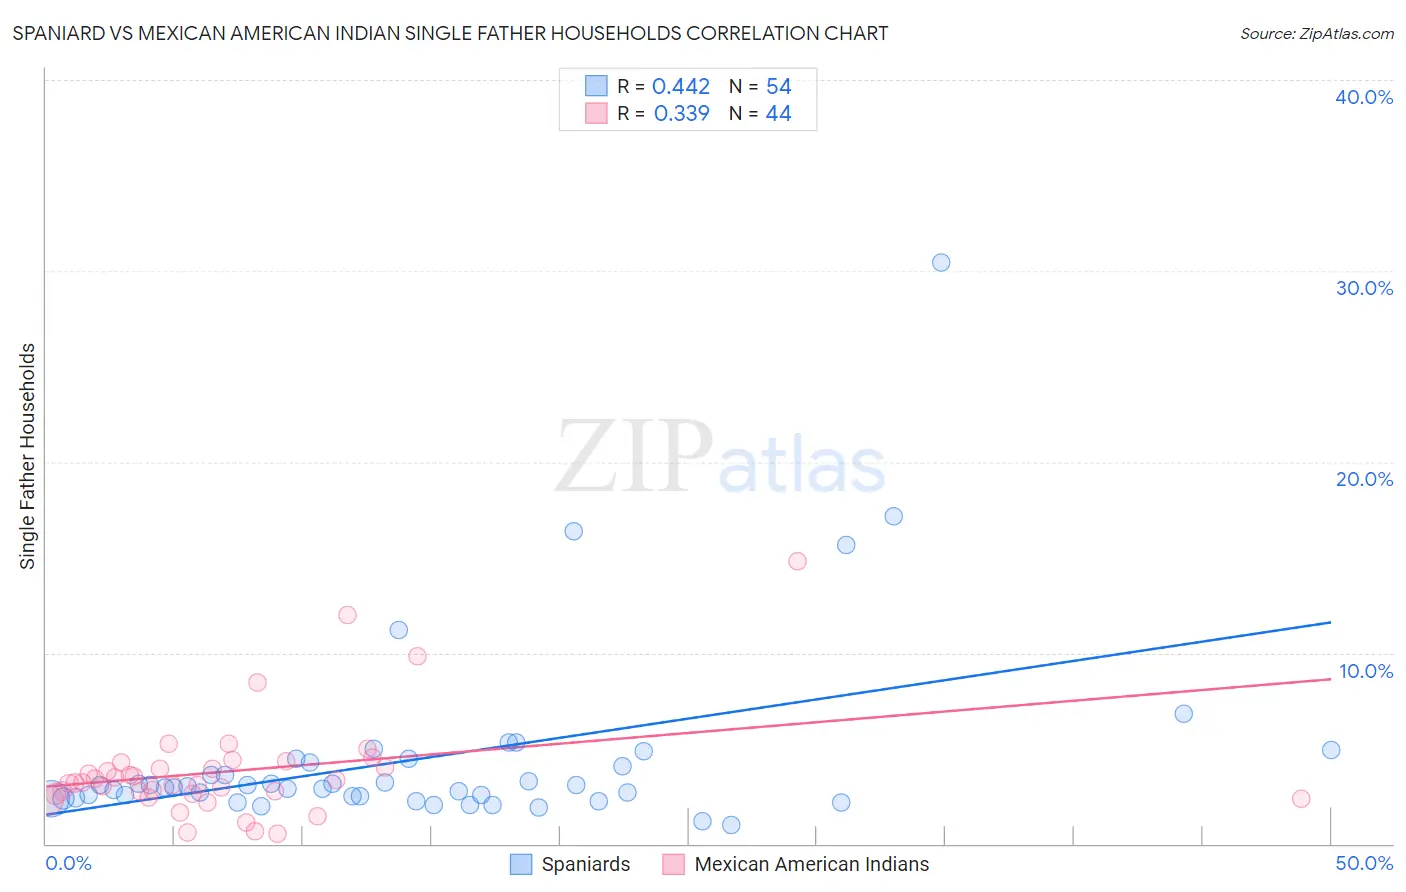
Spaniard vs Mexican American Indian Single Father Households Correlation Chart
The statistical analysis conducted on geographies consisting of 438,543,762 people shows a moderate positive correlation between the proportion of Spaniards and percentage of single father households in the United States with a correlation coefficient (R) of 0.442 and weighted average of 2.5%. Similarly, the statistical analysis conducted on geographies consisting of 316,292,461 people shows a mild positive correlation between the proportion of Mexican American Indians and percentage of single father households in the United States with a correlation coefficient (R) of 0.339 and weighted average of 2.8%, a difference of 13.3%.
Single Father Households Correlation Summary
| Measurement | Spaniard | Mexican American Indian |
| Minimum | 1.0% | 0.54% |
| Maximum | 30.4% | 14.8% |
| Range | 29.4% | 14.3% |
| Mean | 4.5% | 3.8% |
| Median | 3.0% | 3.2% |
| Interquartile 25% (IQ1) | 2.4% | 2.6% |
| Interquartile 75% (IQ3) | 4.2% | 4.1% |
| Interquartile Range (IQR) | 1.8% | 1.5% |
| Standard Deviation (Sample) | 5.0% | 2.7% |
| Standard Deviation (Population) | 4.9% | 2.7% |
Similar Demographics by Single Father Households
Demographics Similar to Spaniards by Single Father Households
In terms of single father households, the demographic groups most similar to Spaniards are Immigrants from Middle Africa (2.5%, a difference of 0.19%), Basque (2.5%, a difference of 0.39%), Native Hawaiian (2.5%, a difference of 0.41%), Delaware (2.5%, a difference of 0.43%), and Osage (2.5%, a difference of 0.46%).
| Demographics | Rating | Rank | Single Father Households |
| Cajuns | 6.1 /100 | #236 | Tragic 2.5% |
| Sierra Leoneans | 5.9 /100 | #237 | Tragic 2.5% |
| Immigrants | Sierra Leone | 5.8 /100 | #238 | Tragic 2.5% |
| Immigrants | Oceania | 5.8 /100 | #239 | Tragic 2.5% |
| Immigrants | Dominica | 4.8 /100 | #240 | Tragic 2.5% |
| Portuguese | 4.1 /100 | #241 | Tragic 2.5% |
| Osage | 4.1 /100 | #242 | Tragic 2.5% |
| Spaniards | 3.1 /100 | #243 | Tragic 2.5% |
| Immigrants | Middle Africa | 2.8 /100 | #244 | Tragic 2.5% |
| Basques | 2.5 /100 | #245 | Tragic 2.5% |
| Native Hawaiians | 2.5 /100 | #246 | Tragic 2.5% |
| Delaware | 2.5 /100 | #247 | Tragic 2.5% |
| Bahamians | 2.4 /100 | #248 | Tragic 2.5% |
| Immigrants | Cameroon | 2.3 /100 | #249 | Tragic 2.5% |
| Somalis | 2.1 /100 | #250 | Tragic 2.5% |
Demographics Similar to Mexican American Indians by Single Father Households
In terms of single father households, the demographic groups most similar to Mexican American Indians are Hispanic or Latino (2.8%, a difference of 0.15%), Immigrants from the Azores (2.8%, a difference of 0.31%), Immigrants from Honduras (2.8%, a difference of 0.32%), Spanish American (2.8%, a difference of 0.33%), and Hopi (2.8%, a difference of 0.48%).
| Demographics | Rating | Rank | Single Father Households |
| Hondurans | 0.0 /100 | #297 | Tragic 2.8% |
| Cree | 0.0 /100 | #298 | Tragic 2.8% |
| Lumbee | 0.0 /100 | #299 | Tragic 2.8% |
| Kiowa | 0.0 /100 | #300 | Tragic 2.8% |
| Immigrants | Latin America | 0.0 /100 | #301 | Tragic 2.8% |
| Spanish Americans | 0.0 /100 | #302 | Tragic 2.8% |
| Immigrants | Honduras | 0.0 /100 | #303 | Tragic 2.8% |
| Mexican American Indians | 0.0 /100 | #304 | Tragic 2.8% |
| Hispanics or Latinos | 0.0 /100 | #305 | Tragic 2.8% |
| Immigrants | Azores | 0.0 /100 | #306 | Tragic 2.8% |
| Hopi | 0.0 /100 | #307 | Tragic 2.8% |
| Apache | 0.0 /100 | #308 | Tragic 2.8% |
| Central Americans | 0.0 /100 | #309 | Tragic 2.9% |
| Immigrants | Laos | 0.0 /100 | #310 | Tragic 2.9% |
| Spanish American Indians | 0.0 /100 | #311 | Tragic 2.9% |