Paraguayan vs Navajo Family Households
COMPARE
Paraguayan
Navajo
Family Households
Family Households Comparison
Paraguayans
Navajo
64.1%
FAMILY HOUSEHOLDS
26.7/ 100
METRIC RATING
188th/ 347
METRIC RANK
66.4%
FAMILY HOUSEHOLDS
100.0/ 100
METRIC RATING
50th/ 347
METRIC RANK
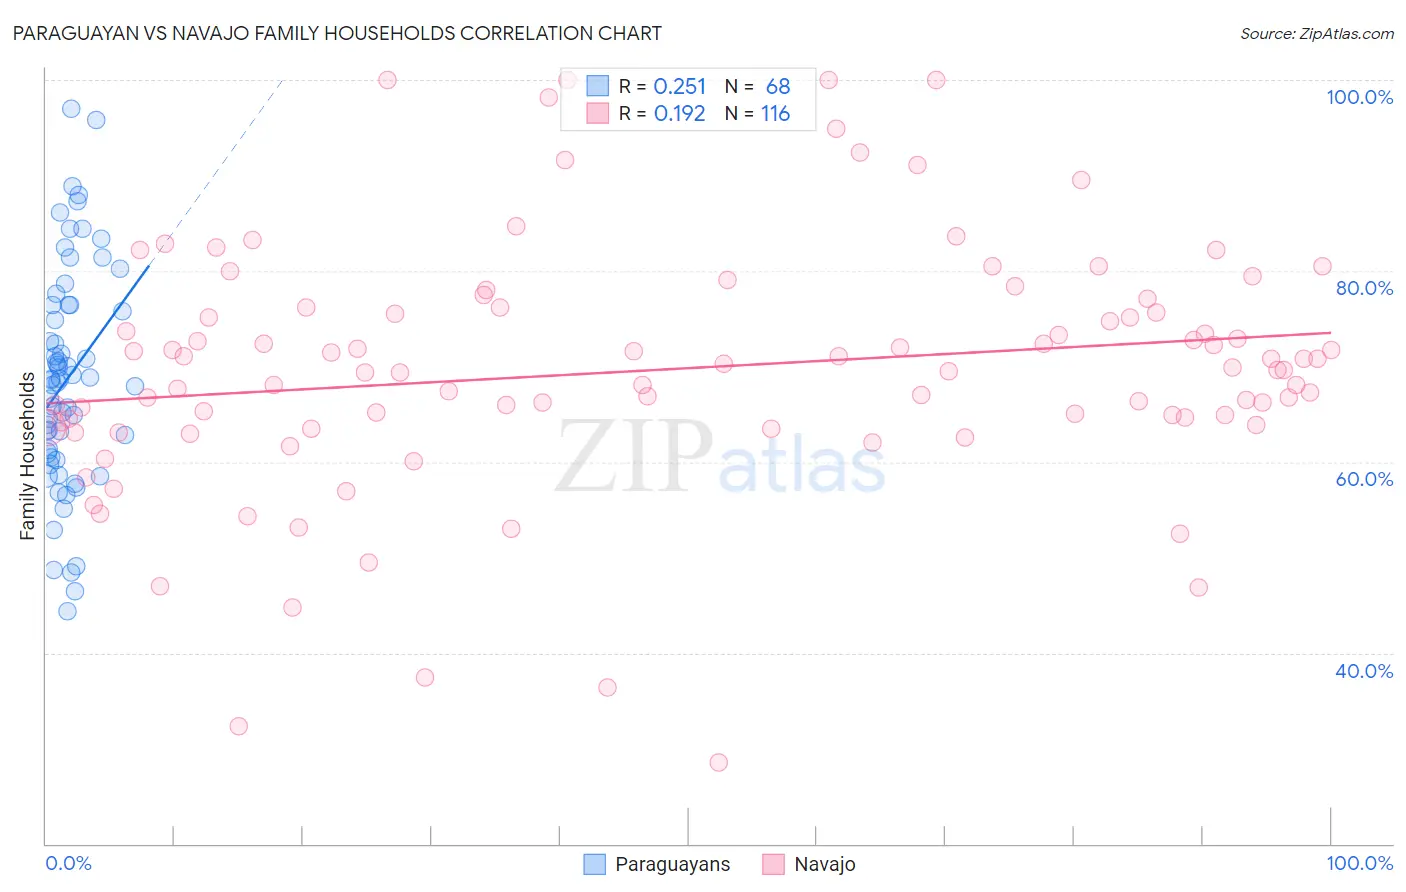
Paraguayan vs Navajo Family Households Correlation Chart
The statistical analysis conducted on geographies consisting of 95,096,913 people shows a weak positive correlation between the proportion of Paraguayans and percentage of family households in the United States with a correlation coefficient (R) of 0.251 and weighted average of 64.1%. Similarly, the statistical analysis conducted on geographies consisting of 224,752,458 people shows a poor positive correlation between the proportion of Navajo and percentage of family households in the United States with a correlation coefficient (R) of 0.192 and weighted average of 66.4%, a difference of 3.6%.
Family Households Correlation Summary
| Measurement | Paraguayan | Navajo |
| Minimum | 44.3% | 28.6% |
| Maximum | 96.9% | 100.0% |
| Range | 52.6% | 71.4% |
| Mean | 68.8% | 69.7% |
| Median | 68.7% | 69.7% |
| Interquartile 25% (IQ1) | 60.7% | 64.0% |
| Interquartile 75% (IQ3) | 76.4% | 75.9% |
| Interquartile Range (IQR) | 15.7% | 11.9% |
| Standard Deviation (Sample) | 11.5% | 13.1% |
| Standard Deviation (Population) | 11.5% | 13.0% |
Similar Demographics by Family Households
Demographics Similar to Paraguayans by Family Households
In terms of family households, the demographic groups most similar to Paraguayans are Immigrants from Western Asia (64.1%, a difference of 0.020%), Northern European (64.1%, a difference of 0.030%), Zimbabwean (64.1%, a difference of 0.040%), Arab (64.1%, a difference of 0.040%), and Lithuanian (64.0%, a difference of 0.050%).
| Demographics | Rating | Rank | Family Households |
| Immigrants | Trinidad and Tobago | 34.9 /100 | #181 | Fair 64.2% |
| Ukrainians | 34.6 /100 | #182 | Fair 64.2% |
| Creek | 34.1 /100 | #183 | Fair 64.2% |
| Puerto Ricans | 33.4 /100 | #184 | Fair 64.2% |
| Immigrants | Iran | 30.4 /100 | #185 | Fair 64.1% |
| Spanish Americans | 30.1 /100 | #186 | Fair 64.1% |
| Northern Europeans | 28.2 /100 | #187 | Fair 64.1% |
| Paraguayans | 26.7 /100 | #188 | Fair 64.1% |
| Immigrants | Western Asia | 25.3 /100 | #189 | Fair 64.1% |
| Zimbabweans | 24.7 /100 | #190 | Fair 64.1% |
| Arabs | 24.5 /100 | #191 | Fair 64.1% |
| Lithuanians | 23.8 /100 | #192 | Fair 64.0% |
| French | 23.7 /100 | #193 | Fair 64.0% |
| Paiute | 22.2 /100 | #194 | Fair 64.0% |
| Immigrants | North America | 20.0 /100 | #195 | Poor 64.0% |
Demographics Similar to Navajo by Family Households
In terms of family households, the demographic groups most similar to Navajo are Native/Alaskan (66.4%, a difference of 0.030%), Immigrants from South Central Asia (66.4%, a difference of 0.070%), Immigrants from Venezuela (66.4%, a difference of 0.12%), Bolivian (66.5%, a difference of 0.14%), and Colombian (66.3%, a difference of 0.16%).
| Demographics | Rating | Rank | Family Households |
| Apache | 100.0 /100 | #43 | Exceptional 66.5% |
| Asians | 100.0 /100 | #44 | Exceptional 66.5% |
| Venezuelans | 100.0 /100 | #45 | Exceptional 66.5% |
| Arapaho | 100.0 /100 | #46 | Exceptional 66.5% |
| Bolivians | 100.0 /100 | #47 | Exceptional 66.5% |
| Immigrants | Venezuela | 100.0 /100 | #48 | Exceptional 66.4% |
| Immigrants | South Central Asia | 100.0 /100 | #49 | Exceptional 66.4% |
| Navajo | 100.0 /100 | #50 | Exceptional 66.4% |
| Natives/Alaskans | 100.0 /100 | #51 | Exceptional 66.4% |
| Colombians | 100.0 /100 | #52 | Exceptional 66.3% |
| Afghans | 100.0 /100 | #53 | Exceptional 66.3% |
| Immigrants | Colombia | 100.0 /100 | #54 | Exceptional 66.3% |
| Immigrants | Immigrants | 100.0 /100 | #55 | Exceptional 66.1% |
| Immigrants | Hong Kong | 100.0 /100 | #56 | Exceptional 66.1% |
| Pennsylvania Germans | 100.0 /100 | #57 | Exceptional 66.1% |