Paraguayan vs Immigrants from El Salvador Family Households
COMPARE
Paraguayan
Immigrants from El Salvador
Family Households
Family Households Comparison
Paraguayans
Immigrants from El Salvador
64.1%
FAMILY HOUSEHOLDS
26.7/ 100
METRIC RATING
188th/ 347
METRIC RANK
67.0%
FAMILY HOUSEHOLDS
100.0/ 100
METRIC RATING
39th/ 347
METRIC RANK
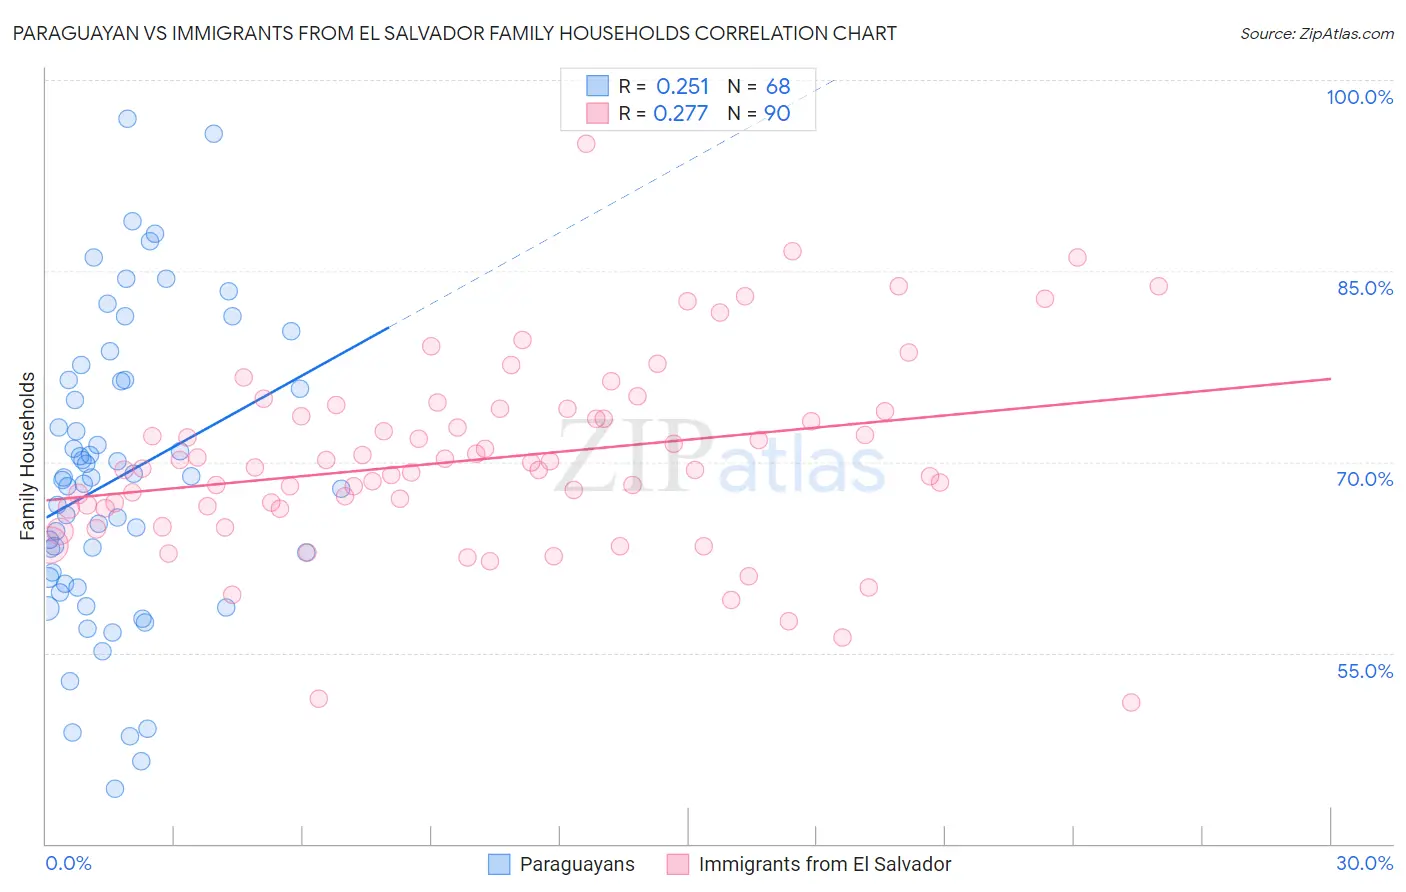
Paraguayan vs Immigrants from El Salvador Family Households Correlation Chart
The statistical analysis conducted on geographies consisting of 95,096,913 people shows a weak positive correlation between the proportion of Paraguayans and percentage of family households in the United States with a correlation coefficient (R) of 0.251 and weighted average of 64.1%. Similarly, the statistical analysis conducted on geographies consisting of 357,711,776 people shows a weak positive correlation between the proportion of Immigrants from El Salvador and percentage of family households in the United States with a correlation coefficient (R) of 0.277 and weighted average of 67.0%, a difference of 4.5%.
Family Households Correlation Summary
| Measurement | Paraguayan | Immigrants from El Salvador |
| Minimum | 44.3% | 51.1% |
| Maximum | 96.9% | 95.0% |
| Range | 52.6% | 43.8% |
| Mean | 68.8% | 70.2% |
| Median | 68.7% | 69.5% |
| Interquartile 25% (IQ1) | 60.7% | 66.4% |
| Interquartile 75% (IQ3) | 76.4% | 73.9% |
| Interquartile Range (IQR) | 15.7% | 7.5% |
| Standard Deviation (Sample) | 11.5% | 7.5% |
| Standard Deviation (Population) | 11.5% | 7.4% |
Similar Demographics by Family Households
Demographics Similar to Paraguayans by Family Households
In terms of family households, the demographic groups most similar to Paraguayans are Immigrants from Western Asia (64.1%, a difference of 0.020%), Northern European (64.1%, a difference of 0.030%), Zimbabwean (64.1%, a difference of 0.040%), Arab (64.1%, a difference of 0.040%), and Lithuanian (64.0%, a difference of 0.050%).
| Demographics | Rating | Rank | Family Households |
| Immigrants | Trinidad and Tobago | 34.9 /100 | #181 | Fair 64.2% |
| Ukrainians | 34.6 /100 | #182 | Fair 64.2% |
| Creek | 34.1 /100 | #183 | Fair 64.2% |
| Puerto Ricans | 33.4 /100 | #184 | Fair 64.2% |
| Immigrants | Iran | 30.4 /100 | #185 | Fair 64.1% |
| Spanish Americans | 30.1 /100 | #186 | Fair 64.1% |
| Northern Europeans | 28.2 /100 | #187 | Fair 64.1% |
| Paraguayans | 26.7 /100 | #188 | Fair 64.1% |
| Immigrants | Western Asia | 25.3 /100 | #189 | Fair 64.1% |
| Zimbabweans | 24.7 /100 | #190 | Fair 64.1% |
| Arabs | 24.5 /100 | #191 | Fair 64.1% |
| Lithuanians | 23.8 /100 | #192 | Fair 64.0% |
| French | 23.7 /100 | #193 | Fair 64.0% |
| Paiute | 22.2 /100 | #194 | Fair 64.0% |
| Immigrants | North America | 20.0 /100 | #195 | Poor 64.0% |
Demographics Similar to Immigrants from El Salvador by Family Households
In terms of family households, the demographic groups most similar to Immigrants from El Salvador are Mexican American Indian (67.0%, a difference of 0.020%), Tsimshian (67.1%, a difference of 0.12%), Peruvian (67.1%, a difference of 0.19%), Tohono O'odham (67.1%, a difference of 0.20%), and Salvadoran (67.2%, a difference of 0.25%).
| Demographics | Rating | Rank | Family Households |
| Nepalese | 100.0 /100 | #32 | Exceptional 67.2% |
| Salvadorans | 100.0 /100 | #33 | Exceptional 67.2% |
| Thais | 100.0 /100 | #34 | Exceptional 67.2% |
| Tohono O'odham | 100.0 /100 | #35 | Exceptional 67.1% |
| Peruvians | 100.0 /100 | #36 | Exceptional 67.1% |
| Tsimshian | 100.0 /100 | #37 | Exceptional 67.1% |
| Mexican American Indians | 100.0 /100 | #38 | Exceptional 67.0% |
| Immigrants | El Salvador | 100.0 /100 | #39 | Exceptional 67.0% |
| Guamanians/Chamorros | 100.0 /100 | #40 | Exceptional 66.6% |
| Immigrants | Bolivia | 100.0 /100 | #41 | Exceptional 66.6% |
| Menominee | 100.0 /100 | #42 | Exceptional 66.5% |
| Apache | 100.0 /100 | #43 | Exceptional 66.5% |
| Asians | 100.0 /100 | #44 | Exceptional 66.5% |
| Venezuelans | 100.0 /100 | #45 | Exceptional 66.5% |
| Arapaho | 100.0 /100 | #46 | Exceptional 66.5% |