Somali vs Navajo Family Households
COMPARE
Somali
Navajo
Family Households
Family Households Comparison
Somalis
Navajo
57.6%
FAMILY HOUSEHOLDS
0.0/ 100
METRIC RATING
346th/ 347
METRIC RANK
66.4%
FAMILY HOUSEHOLDS
100.0/ 100
METRIC RATING
50th/ 347
METRIC RANK
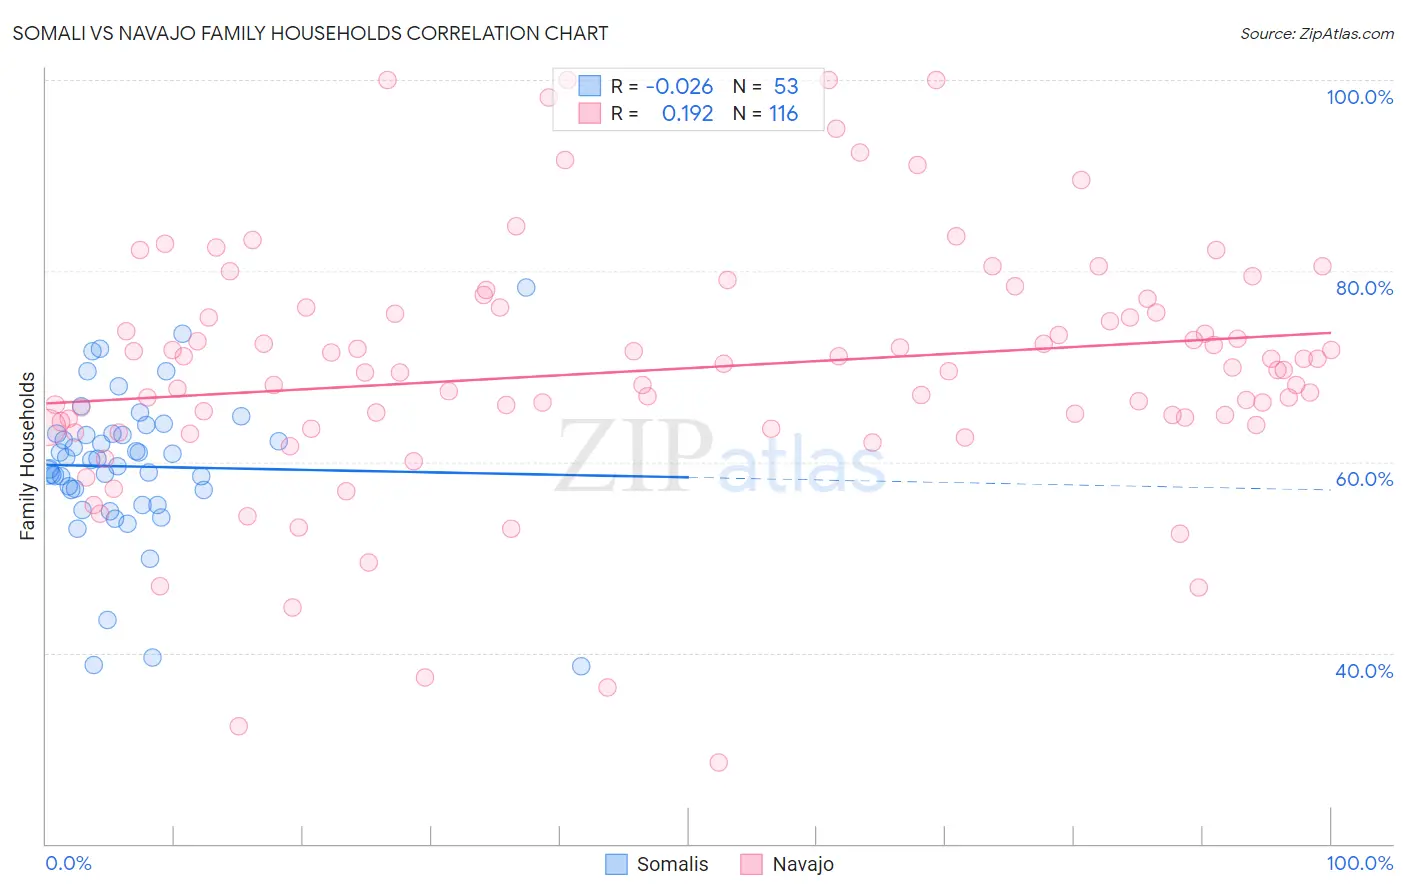
Somali vs Navajo Family Households Correlation Chart
The statistical analysis conducted on geographies consisting of 99,263,237 people shows no correlation between the proportion of Somalis and percentage of family households in the United States with a correlation coefficient (R) of -0.026 and weighted average of 57.6%. Similarly, the statistical analysis conducted on geographies consisting of 224,752,458 people shows a poor positive correlation between the proportion of Navajo and percentage of family households in the United States with a correlation coefficient (R) of 0.192 and weighted average of 66.4%, a difference of 15.1%.
Family Households Correlation Summary
| Measurement | Somali | Navajo |
| Minimum | 38.6% | 28.6% |
| Maximum | 78.2% | 100.0% |
| Range | 39.6% | 71.4% |
| Mean | 59.5% | 69.7% |
| Median | 60.2% | 69.7% |
| Interquartile 25% (IQ1) | 56.3% | 64.0% |
| Interquartile 75% (IQ3) | 62.9% | 75.9% |
| Interquartile Range (IQR) | 6.6% | 11.9% |
| Standard Deviation (Sample) | 7.8% | 13.1% |
| Standard Deviation (Population) | 7.8% | 13.0% |
Similar Demographics by Family Households
Demographics Similar to Somalis by Family Households
In terms of family households, the demographic groups most similar to Somalis are Immigrants from Somalia (56.7%, a difference of 1.7%), Immigrants from Zaire (59.2%, a difference of 2.6%), Immigrants from Congo (59.2%, a difference of 2.8%), Senegalese (59.8%, a difference of 3.8%), and Sudanese (60.0%, a difference of 4.1%).
| Demographics | Rating | Rank | Family Households |
| Immigrants | Ethiopia | 0.0 /100 | #333 | Tragic 61.2% |
| Immigrants | Eastern Africa | 0.0 /100 | #334 | Tragic 61.1% |
| Carpatho Rusyns | 0.0 /100 | #335 | Tragic 61.1% |
| German Russians | 0.0 /100 | #336 | Tragic 60.9% |
| Soviet Union | 0.0 /100 | #337 | Tragic 60.9% |
| Immigrants | Eritrea | 0.0 /100 | #338 | Tragic 60.8% |
| Immigrants | Saudi Arabia | 0.0 /100 | #339 | Tragic 60.7% |
| Immigrants | Sudan | 0.0 /100 | #340 | Tragic 60.2% |
| Immigrants | Senegal | 0.0 /100 | #341 | Tragic 60.1% |
| Sudanese | 0.0 /100 | #342 | Tragic 60.0% |
| Senegalese | 0.0 /100 | #343 | Tragic 59.8% |
| Immigrants | Congo | 0.0 /100 | #344 | Tragic 59.2% |
| Immigrants | Zaire | 0.0 /100 | #345 | Tragic 59.2% |
| Somalis | 0.0 /100 | #346 | Tragic 57.6% |
| Immigrants | Somalia | 0.0 /100 | #347 | Tragic 56.7% |
Demographics Similar to Navajo by Family Households
In terms of family households, the demographic groups most similar to Navajo are Native/Alaskan (66.4%, a difference of 0.030%), Immigrants from South Central Asia (66.4%, a difference of 0.070%), Immigrants from Venezuela (66.4%, a difference of 0.12%), Bolivian (66.5%, a difference of 0.14%), and Colombian (66.3%, a difference of 0.16%).
| Demographics | Rating | Rank | Family Households |
| Apache | 100.0 /100 | #43 | Exceptional 66.5% |
| Asians | 100.0 /100 | #44 | Exceptional 66.5% |
| Venezuelans | 100.0 /100 | #45 | Exceptional 66.5% |
| Arapaho | 100.0 /100 | #46 | Exceptional 66.5% |
| Bolivians | 100.0 /100 | #47 | Exceptional 66.5% |
| Immigrants | Venezuela | 100.0 /100 | #48 | Exceptional 66.4% |
| Immigrants | South Central Asia | 100.0 /100 | #49 | Exceptional 66.4% |
| Navajo | 100.0 /100 | #50 | Exceptional 66.4% |
| Natives/Alaskans | 100.0 /100 | #51 | Exceptional 66.4% |
| Colombians | 100.0 /100 | #52 | Exceptional 66.3% |
| Afghans | 100.0 /100 | #53 | Exceptional 66.3% |
| Immigrants | Colombia | 100.0 /100 | #54 | Exceptional 66.3% |
| Immigrants | Immigrants | 100.0 /100 | #55 | Exceptional 66.1% |
| Immigrants | Hong Kong | 100.0 /100 | #56 | Exceptional 66.1% |
| Pennsylvania Germans | 100.0 /100 | #57 | Exceptional 66.1% |