Paraguayan vs Immigrants from Thailand Family Households
COMPARE
Paraguayan
Immigrants from Thailand
Family Households
Family Households Comparison
Paraguayans
Immigrants from Thailand
64.1%
FAMILY HOUSEHOLDS
26.7/ 100
METRIC RATING
188th/ 347
METRIC RANK
63.8%
FAMILY HOUSEHOLDS
9.6/ 100
METRIC RATING
210th/ 347
METRIC RANK
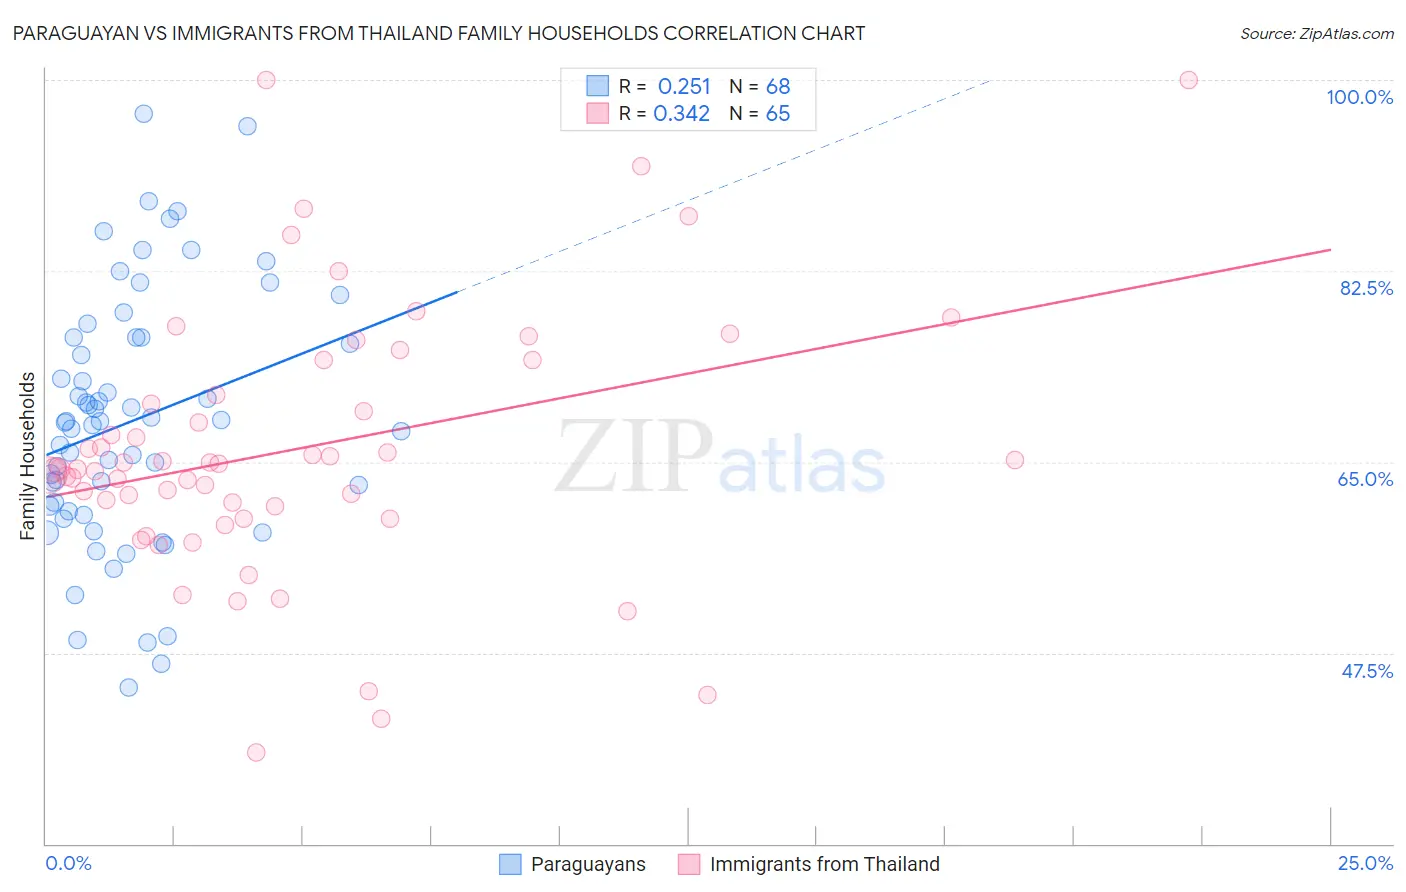
Paraguayan vs Immigrants from Thailand Family Households Correlation Chart
The statistical analysis conducted on geographies consisting of 95,096,913 people shows a weak positive correlation between the proportion of Paraguayans and percentage of family households in the United States with a correlation coefficient (R) of 0.251 and weighted average of 64.1%. Similarly, the statistical analysis conducted on geographies consisting of 316,927,069 people shows a mild positive correlation between the proportion of Immigrants from Thailand and percentage of family households in the United States with a correlation coefficient (R) of 0.342 and weighted average of 63.8%, a difference of 0.42%.
Family Households Correlation Summary
| Measurement | Paraguayan | Immigrants from Thailand |
| Minimum | 44.3% | 38.4% |
| Maximum | 96.9% | 100.0% |
| Range | 52.6% | 61.6% |
| Mean | 68.8% | 66.2% |
| Median | 68.7% | 64.4% |
| Interquartile 25% (IQ1) | 60.7% | 60.4% |
| Interquartile 75% (IQ3) | 76.4% | 72.7% |
| Interquartile Range (IQR) | 15.7% | 12.3% |
| Standard Deviation (Sample) | 11.5% | 12.2% |
| Standard Deviation (Population) | 11.5% | 12.1% |
Similar Demographics by Family Households
Demographics Similar to Paraguayans by Family Households
In terms of family households, the demographic groups most similar to Paraguayans are Immigrants from Western Asia (64.1%, a difference of 0.020%), Northern European (64.1%, a difference of 0.030%), Zimbabwean (64.1%, a difference of 0.040%), Arab (64.1%, a difference of 0.040%), and Lithuanian (64.0%, a difference of 0.050%).
| Demographics | Rating | Rank | Family Households |
| Immigrants | Trinidad and Tobago | 34.9 /100 | #181 | Fair 64.2% |
| Ukrainians | 34.6 /100 | #182 | Fair 64.2% |
| Creek | 34.1 /100 | #183 | Fair 64.2% |
| Puerto Ricans | 33.4 /100 | #184 | Fair 64.2% |
| Immigrants | Iran | 30.4 /100 | #185 | Fair 64.1% |
| Spanish Americans | 30.1 /100 | #186 | Fair 64.1% |
| Northern Europeans | 28.2 /100 | #187 | Fair 64.1% |
| Paraguayans | 26.7 /100 | #188 | Fair 64.1% |
| Immigrants | Western Asia | 25.3 /100 | #189 | Fair 64.1% |
| Zimbabweans | 24.7 /100 | #190 | Fair 64.1% |
| Arabs | 24.5 /100 | #191 | Fair 64.1% |
| Lithuanians | 23.8 /100 | #192 | Fair 64.0% |
| French | 23.7 /100 | #193 | Fair 64.0% |
| Paiute | 22.2 /100 | #194 | Fair 64.0% |
| Immigrants | North America | 20.0 /100 | #195 | Poor 64.0% |
Demographics Similar to Immigrants from Thailand by Family Households
In terms of family households, the demographic groups most similar to Immigrants from Thailand are Shoshone (63.8%, a difference of 0.010%), Immigrants from Netherlands (63.8%, a difference of 0.010%), Immigrants from Northern Europe (63.8%, a difference of 0.030%), Immigrants from Bangladesh (63.9%, a difference of 0.060%), and Sierra Leonean (63.9%, a difference of 0.060%).
| Demographics | Rating | Rank | Family Households |
| Norwegians | 13.2 /100 | #203 | Poor 63.9% |
| Immigrants | Uruguay | 12.8 /100 | #204 | Poor 63.9% |
| Brazilians | 12.4 /100 | #205 | Poor 63.9% |
| Immigrants | Lithuania | 12.1 /100 | #206 | Poor 63.9% |
| Nigerians | 11.5 /100 | #207 | Poor 63.9% |
| Immigrants | Bangladesh | 11.4 /100 | #208 | Poor 63.9% |
| Sierra Leoneans | 11.2 /100 | #209 | Poor 63.9% |
| Immigrants | Thailand | 9.6 /100 | #210 | Tragic 63.8% |
| Shoshone | 9.4 /100 | #211 | Tragic 63.8% |
| Immigrants | Netherlands | 9.4 /100 | #212 | Tragic 63.8% |
| Immigrants | Northern Europe | 8.8 /100 | #213 | Tragic 63.8% |
| Celtics | 8.0 /100 | #214 | Tragic 63.8% |
| Belgians | 7.6 /100 | #215 | Tragic 63.8% |
| Croatians | 7.3 /100 | #216 | Tragic 63.8% |
| Osage | 7.0 /100 | #217 | Tragic 63.7% |