Paraguayan vs Puget Sound Salish Family Households
COMPARE
Paraguayan
Puget Sound Salish
Family Households
Family Households Comparison
Paraguayans
Puget Sound Salish
64.1%
FAMILY HOUSEHOLDS
26.7/ 100
METRIC RATING
188th/ 347
METRIC RANK
65.6%
FAMILY HOUSEHOLDS
99.8/ 100
METRIC RATING
80th/ 347
METRIC RANK
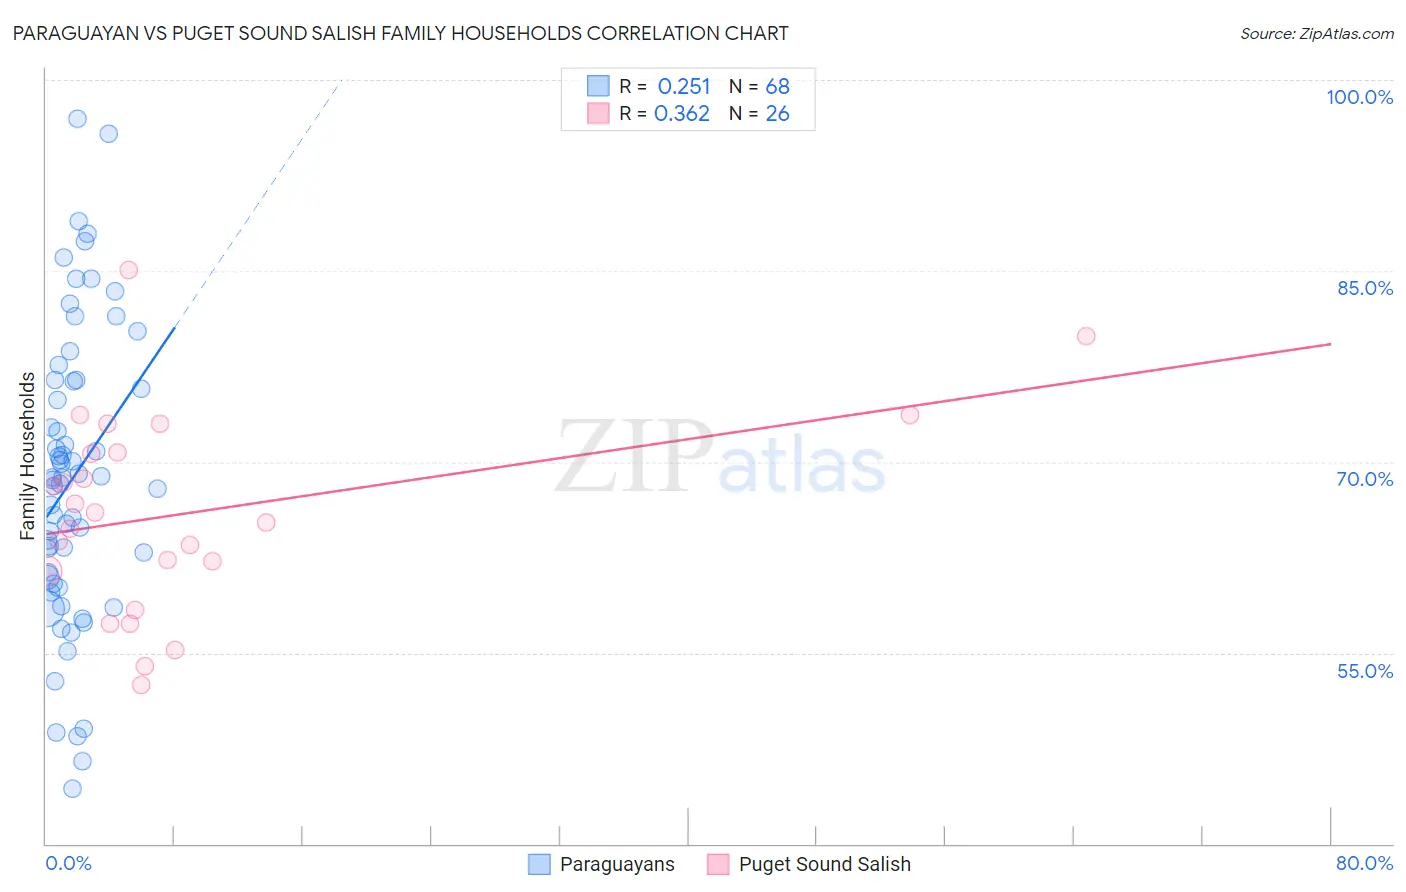
Paraguayan vs Puget Sound Salish Family Households Correlation Chart
The statistical analysis conducted on geographies consisting of 95,096,913 people shows a weak positive correlation between the proportion of Paraguayans and percentage of family households in the United States with a correlation coefficient (R) of 0.251 and weighted average of 64.1%. Similarly, the statistical analysis conducted on geographies consisting of 46,155,865 people shows a mild positive correlation between the proportion of Puget Sound Salish and percentage of family households in the United States with a correlation coefficient (R) of 0.362 and weighted average of 65.6%, a difference of 2.4%.
Family Households Correlation Summary
| Measurement | Paraguayan | Puget Sound Salish |
| Minimum | 44.3% | 52.5% |
| Maximum | 96.9% | 85.1% |
| Range | 52.6% | 32.6% |
| Mean | 68.8% | 66.0% |
| Median | 68.7% | 65.6% |
| Interquartile 25% (IQ1) | 60.7% | 61.4% |
| Interquartile 75% (IQ3) | 76.4% | 70.8% |
| Interquartile Range (IQR) | 15.7% | 9.4% |
| Standard Deviation (Sample) | 11.5% | 7.9% |
| Standard Deviation (Population) | 11.5% | 7.7% |
Similar Demographics by Family Households
Demographics Similar to Paraguayans by Family Households
In terms of family households, the demographic groups most similar to Paraguayans are Immigrants from Western Asia (64.1%, a difference of 0.020%), Northern European (64.1%, a difference of 0.030%), Zimbabwean (64.1%, a difference of 0.040%), Arab (64.1%, a difference of 0.040%), and Lithuanian (64.0%, a difference of 0.050%).
| Demographics | Rating | Rank | Family Households |
| Immigrants | Trinidad and Tobago | 34.9 /100 | #181 | Fair 64.2% |
| Ukrainians | 34.6 /100 | #182 | Fair 64.2% |
| Creek | 34.1 /100 | #183 | Fair 64.2% |
| Puerto Ricans | 33.4 /100 | #184 | Fair 64.2% |
| Immigrants | Iran | 30.4 /100 | #185 | Fair 64.1% |
| Spanish Americans | 30.1 /100 | #186 | Fair 64.1% |
| Northern Europeans | 28.2 /100 | #187 | Fair 64.1% |
| Paraguayans | 26.7 /100 | #188 | Fair 64.1% |
| Immigrants | Western Asia | 25.3 /100 | #189 | Fair 64.1% |
| Zimbabweans | 24.7 /100 | #190 | Fair 64.1% |
| Arabs | 24.5 /100 | #191 | Fair 64.1% |
| Lithuanians | 23.8 /100 | #192 | Fair 64.0% |
| French | 23.7 /100 | #193 | Fair 64.0% |
| Paiute | 22.2 /100 | #194 | Fair 64.0% |
| Immigrants | North America | 20.0 /100 | #195 | Poor 64.0% |
Demographics Similar to Puget Sound Salish by Family Households
In terms of family households, the demographic groups most similar to Puget Sound Salish are Immigrants from Costa Rica (65.6%, a difference of 0.010%), Immigrants from South America (65.6%, a difference of 0.050%), Yaqui (65.6%, a difference of 0.050%), Immigrants from the Azores (65.6%, a difference of 0.060%), and Jordanian (65.5%, a difference of 0.080%).
| Demographics | Rating | Rank | Family Households |
| Laotians | 99.9 /100 | #73 | Exceptional 65.8% |
| Burmese | 99.9 /100 | #74 | Exceptional 65.7% |
| Houma | 99.9 /100 | #75 | Exceptional 65.7% |
| Immigrants | Azores | 99.8 /100 | #76 | Exceptional 65.6% |
| Immigrants | South America | 99.8 /100 | #77 | Exceptional 65.6% |
| Yaqui | 99.8 /100 | #78 | Exceptional 65.6% |
| Immigrants | Costa Rica | 99.8 /100 | #79 | Exceptional 65.6% |
| Puget Sound Salish | 99.8 /100 | #80 | Exceptional 65.6% |
| Jordanians | 99.7 /100 | #81 | Exceptional 65.5% |
| Immigrants | Lebanon | 99.7 /100 | #82 | Exceptional 65.5% |
| Immigrants | Guyana | 99.6 /100 | #83 | Exceptional 65.5% |
| Americans | 99.6 /100 | #84 | Exceptional 65.5% |
| Immigrants | Cambodia | 99.5 /100 | #85 | Exceptional 65.4% |
| Egyptians | 99.4 /100 | #86 | Exceptional 65.4% |
| Immigrants | Egypt | 99.2 /100 | #87 | Exceptional 65.3% |