Panamanian vs Immigrants from Ecuador Married-couple Households
COMPARE
Panamanian
Immigrants from Ecuador
Married-couple Households
Married-couple Households Comparison
Panamanians
Immigrants from Ecuador
45.2%
MARRIED-COUPLE HOUSEHOLDS
5.5/ 100
METRIC RATING
217th/ 347
METRIC RANK
42.9%
MARRIED-COUPLE HOUSEHOLDS
0.0/ 100
METRIC RATING
280th/ 347
METRIC RANK
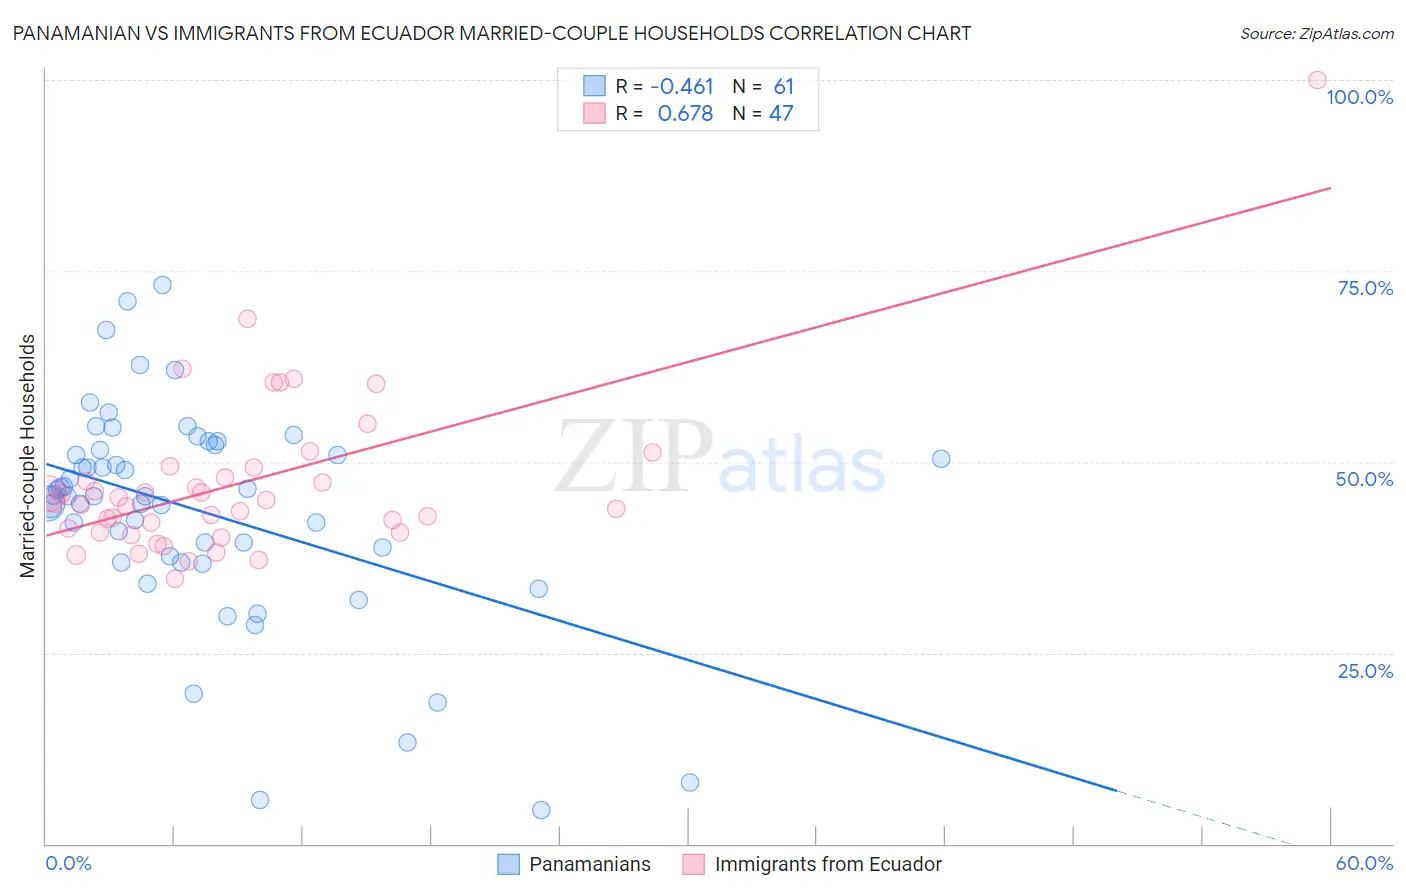
Panamanian vs Immigrants from Ecuador Married-couple Households Correlation Chart
The statistical analysis conducted on geographies consisting of 281,067,413 people shows a moderate negative correlation between the proportion of Panamanians and percentage of married-couple family households in the United States with a correlation coefficient (R) of -0.461 and weighted average of 45.2%. Similarly, the statistical analysis conducted on geographies consisting of 270,883,052 people shows a significant positive correlation between the proportion of Immigrants from Ecuador and percentage of married-couple family households in the United States with a correlation coefficient (R) of 0.678 and weighted average of 42.9%, a difference of 5.5%.
Married-couple Households Correlation Summary
| Measurement | Panamanian | Immigrants from Ecuador |
| Minimum | 4.4% | 34.8% |
| Maximum | 73.1% | 100.0% |
| Range | 68.8% | 65.2% |
| Mean | 43.6% | 47.2% |
| Median | 45.6% | 44.7% |
| Interquartile 25% (IQ1) | 37.2% | 40.8% |
| Interquartile 75% (IQ3) | 51.9% | 49.2% |
| Interquartile Range (IQR) | 14.7% | 8.5% |
| Standard Deviation (Sample) | 14.2% | 10.9% |
| Standard Deviation (Population) | 14.0% | 10.8% |
Similar Demographics by Married-couple Households
Demographics Similar to Panamanians by Married-couple Households
In terms of married-couple households, the demographic groups most similar to Panamanians are Immigrants from Nepal (45.2%, a difference of 0.020%), Immigrants from Portugal (45.2%, a difference of 0.020%), Immigrants from the Azores (45.2%, a difference of 0.030%), Nicaraguan (45.2%, a difference of 0.030%), and Japanese (45.2%, a difference of 0.040%).
| Demographics | Rating | Rank | Married-couple Households |
| Cubans | 7.7 /100 | #210 | Tragic 45.4% |
| Immigrants | Spain | 7.3 /100 | #211 | Tragic 45.3% |
| Creek | 6.4 /100 | #212 | Tragic 45.3% |
| Yakama | 5.8 /100 | #213 | Tragic 45.2% |
| Japanese | 5.7 /100 | #214 | Tragic 45.2% |
| Immigrants | Nepal | 5.6 /100 | #215 | Tragic 45.2% |
| Immigrants | Portugal | 5.6 /100 | #216 | Tragic 45.2% |
| Panamanians | 5.5 /100 | #217 | Tragic 45.2% |
| Immigrants | Azores | 5.3 /100 | #218 | Tragic 45.2% |
| Nicaraguans | 5.3 /100 | #219 | Tragic 45.2% |
| Immigrants | Thailand | 5.1 /100 | #220 | Tragic 45.2% |
| Tlingit-Haida | 4.9 /100 | #221 | Tragic 45.1% |
| Immigrants | Laos | 4.6 /100 | #222 | Tragic 45.1% |
| Immigrants | Cambodia | 2.7 /100 | #223 | Tragic 44.9% |
| Immigrants | Micronesia | 2.6 /100 | #224 | Tragic 44.9% |
Demographics Similar to Immigrants from Ecuador by Married-couple Households
In terms of married-couple households, the demographic groups most similar to Immigrants from Ecuador are Sierra Leonean (42.9%, a difference of 0.050%), Immigrants from Guatemala (42.8%, a difference of 0.070%), Immigrants from Africa (42.9%, a difference of 0.080%), Immigrants from Eastern Africa (42.9%, a difference of 0.19%), and Immigrants from Ethiopia (43.1%, a difference of 0.45%).
| Demographics | Rating | Rank | Married-couple Households |
| Ethiopians | 0.1 /100 | #273 | Tragic 43.2% |
| Nigerians | 0.1 /100 | #274 | Tragic 43.2% |
| Immigrants | Bangladesh | 0.0 /100 | #275 | Tragic 43.1% |
| Immigrants | Ethiopia | 0.0 /100 | #276 | Tragic 43.1% |
| Immigrants | Eastern Africa | 0.0 /100 | #277 | Tragic 42.9% |
| Immigrants | Africa | 0.0 /100 | #278 | Tragic 42.9% |
| Sierra Leoneans | 0.0 /100 | #279 | Tragic 42.9% |
| Immigrants | Ecuador | 0.0 /100 | #280 | Tragic 42.9% |
| Immigrants | Guatemala | 0.0 /100 | #281 | Tragic 42.8% |
| Bermudans | 0.0 /100 | #282 | Tragic 42.4% |
| Inupiat | 0.0 /100 | #283 | Tragic 42.4% |
| Cheyenne | 0.0 /100 | #284 | Tragic 42.3% |
| Ghanaians | 0.0 /100 | #285 | Tragic 42.2% |
| Belizeans | 0.0 /100 | #286 | Tragic 42.2% |
| Chippewa | 0.0 /100 | #287 | Tragic 42.1% |