Immigrants from Senegal vs Immigrants from Ecuador Married-couple Households
COMPARE
Immigrants from Senegal
Immigrants from Ecuador
Married-couple Households
Married-couple Households Comparison
Immigrants from Senegal
Immigrants from Ecuador
38.4%
MARRIED-COUPLE HOUSEHOLDS
0.0/ 100
METRIC RATING
338th/ 347
METRIC RANK
42.9%
MARRIED-COUPLE HOUSEHOLDS
0.0/ 100
METRIC RATING
280th/ 347
METRIC RANK
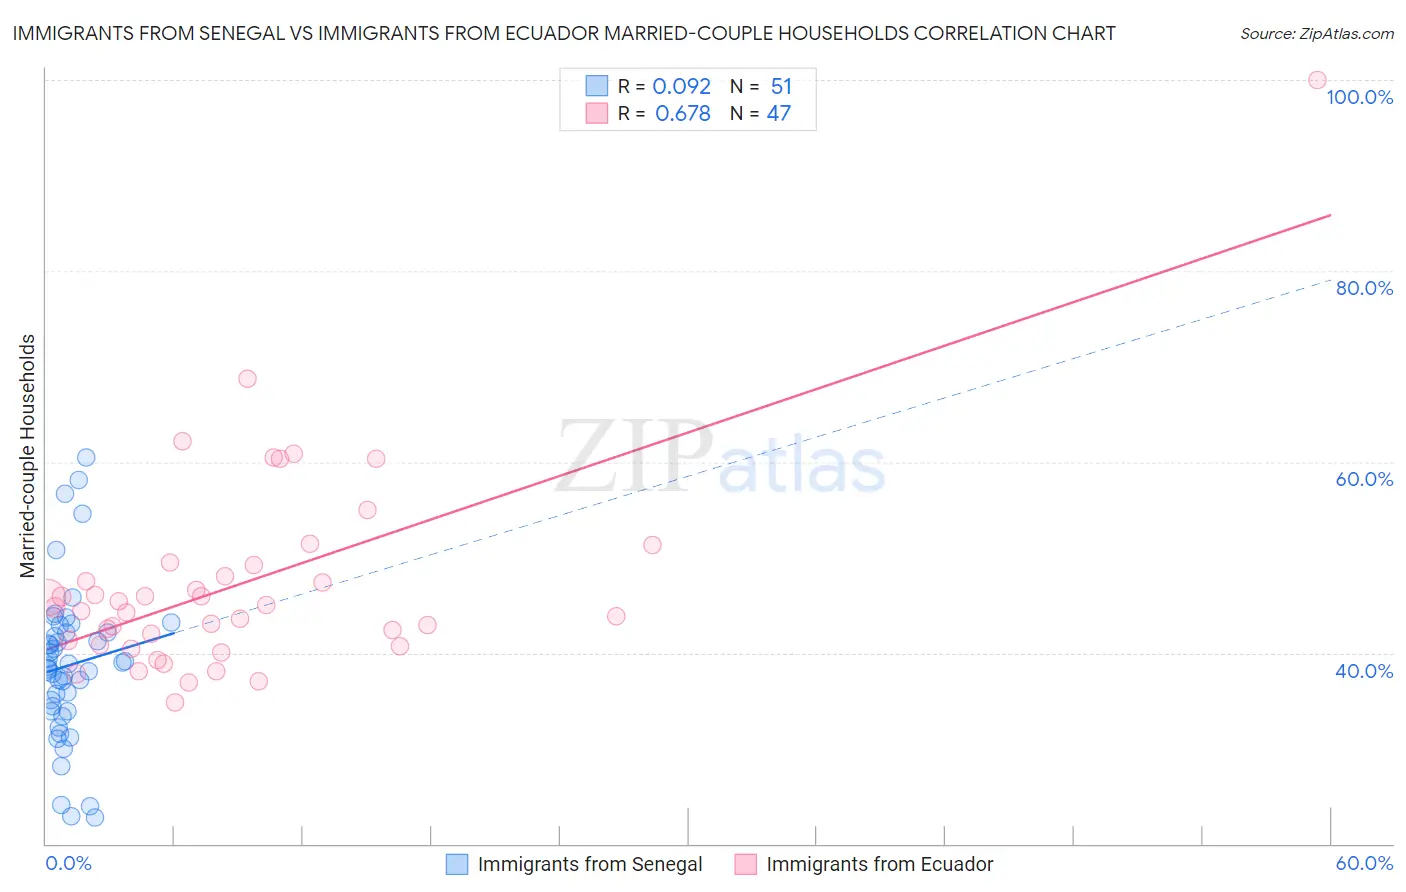
Immigrants from Senegal vs Immigrants from Ecuador Married-couple Households Correlation Chart
The statistical analysis conducted on geographies consisting of 90,124,695 people shows a slight positive correlation between the proportion of Immigrants from Senegal and percentage of married-couple family households in the United States with a correlation coefficient (R) of 0.092 and weighted average of 38.4%. Similarly, the statistical analysis conducted on geographies consisting of 270,883,052 people shows a significant positive correlation between the proportion of Immigrants from Ecuador and percentage of married-couple family households in the United States with a correlation coefficient (R) of 0.678 and weighted average of 42.9%, a difference of 11.7%.
Married-couple Households Correlation Summary
| Measurement | Immigrants from Senegal | Immigrants from Ecuador |
| Minimum | 22.8% | 34.8% |
| Maximum | 60.5% | 100.0% |
| Range | 37.7% | 65.2% |
| Mean | 38.7% | 47.2% |
| Median | 38.6% | 44.7% |
| Interquartile 25% (IQ1) | 33.9% | 40.8% |
| Interquartile 75% (IQ3) | 42.2% | 49.2% |
| Interquartile Range (IQR) | 8.2% | 8.5% |
| Standard Deviation (Sample) | 8.1% | 10.9% |
| Standard Deviation (Population) | 8.0% | 10.8% |
Similar Demographics by Married-couple Households
Demographics Similar to Immigrants from Senegal by Married-couple Households
In terms of married-couple households, the demographic groups most similar to Immigrants from Senegal are British West Indian (38.3%, a difference of 0.13%), Immigrants from Somalia (38.4%, a difference of 0.16%), Black/African American (38.5%, a difference of 0.30%), Senegalese (38.6%, a difference of 0.48%), and Dominican (38.2%, a difference of 0.50%).
| Demographics | Rating | Rank | Married-couple Households |
| Immigrants | Congo | 0.0 /100 | #331 | Tragic 39.0% |
| Somalis | 0.0 /100 | #332 | Tragic 39.0% |
| Immigrants | West Indies | 0.0 /100 | #333 | Tragic 39.0% |
| Immigrants | St. Vincent and the Grenadines | 0.0 /100 | #334 | Tragic 38.7% |
| Senegalese | 0.0 /100 | #335 | Tragic 38.6% |
| Blacks/African Americans | 0.0 /100 | #336 | Tragic 38.5% |
| Immigrants | Somalia | 0.0 /100 | #337 | Tragic 38.4% |
| Immigrants | Senegal | 0.0 /100 | #338 | Tragic 38.4% |
| British West Indians | 0.0 /100 | #339 | Tragic 38.3% |
| Dominicans | 0.0 /100 | #340 | Tragic 38.2% |
| Cape Verdeans | 0.0 /100 | #341 | Tragic 38.1% |
| Tohono O'odham | 0.0 /100 | #342 | Tragic 37.9% |
| Immigrants | Grenada | 0.0 /100 | #343 | Tragic 37.5% |
| Immigrants | Dominican Republic | 0.0 /100 | #344 | Tragic 37.3% |
| Hopi | 0.0 /100 | #345 | Tragic 36.7% |
Demographics Similar to Immigrants from Ecuador by Married-couple Households
In terms of married-couple households, the demographic groups most similar to Immigrants from Ecuador are Sierra Leonean (42.9%, a difference of 0.050%), Immigrants from Guatemala (42.8%, a difference of 0.070%), Immigrants from Africa (42.9%, a difference of 0.080%), Immigrants from Eastern Africa (42.9%, a difference of 0.19%), and Immigrants from Ethiopia (43.1%, a difference of 0.45%).
| Demographics | Rating | Rank | Married-couple Households |
| Ethiopians | 0.1 /100 | #273 | Tragic 43.2% |
| Nigerians | 0.1 /100 | #274 | Tragic 43.2% |
| Immigrants | Bangladesh | 0.0 /100 | #275 | Tragic 43.1% |
| Immigrants | Ethiopia | 0.0 /100 | #276 | Tragic 43.1% |
| Immigrants | Eastern Africa | 0.0 /100 | #277 | Tragic 42.9% |
| Immigrants | Africa | 0.0 /100 | #278 | Tragic 42.9% |
| Sierra Leoneans | 0.0 /100 | #279 | Tragic 42.9% |
| Immigrants | Ecuador | 0.0 /100 | #280 | Tragic 42.9% |
| Immigrants | Guatemala | 0.0 /100 | #281 | Tragic 42.8% |
| Bermudans | 0.0 /100 | #282 | Tragic 42.4% |
| Inupiat | 0.0 /100 | #283 | Tragic 42.4% |
| Cheyenne | 0.0 /100 | #284 | Tragic 42.3% |
| Ghanaians | 0.0 /100 | #285 | Tragic 42.2% |
| Belizeans | 0.0 /100 | #286 | Tragic 42.2% |
| Chippewa | 0.0 /100 | #287 | Tragic 42.1% |