Immigrants from Venezuela vs Immigrants from Ecuador Married-couple Households
COMPARE
Immigrants from Venezuela
Immigrants from Ecuador
Married-couple Households
Married-couple Households Comparison
Immigrants from Venezuela
Immigrants from Ecuador
47.4%
MARRIED-COUPLE HOUSEHOLDS
89.3/ 100
METRIC RATING
123rd/ 347
METRIC RANK
42.9%
MARRIED-COUPLE HOUSEHOLDS
0.0/ 100
METRIC RATING
280th/ 347
METRIC RANK
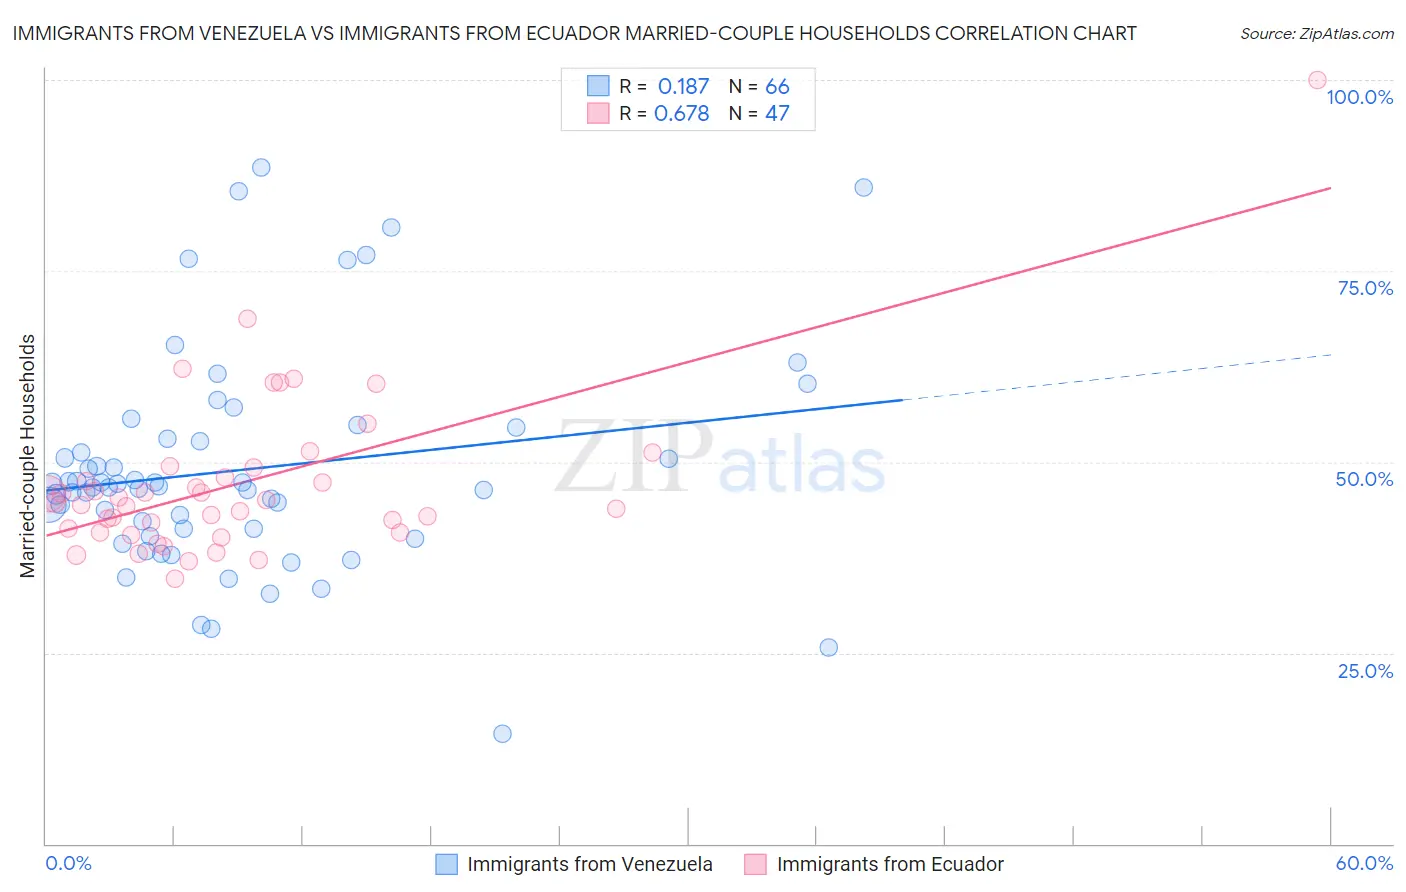
Immigrants from Venezuela vs Immigrants from Ecuador Married-couple Households Correlation Chart
The statistical analysis conducted on geographies consisting of 287,780,225 people shows a poor positive correlation between the proportion of Immigrants from Venezuela and percentage of married-couple family households in the United States with a correlation coefficient (R) of 0.187 and weighted average of 47.4%. Similarly, the statistical analysis conducted on geographies consisting of 270,883,052 people shows a significant positive correlation between the proportion of Immigrants from Ecuador and percentage of married-couple family households in the United States with a correlation coefficient (R) of 0.678 and weighted average of 42.9%, a difference of 10.5%.
Married-couple Households Correlation Summary
| Measurement | Immigrants from Venezuela | Immigrants from Ecuador |
| Minimum | 14.4% | 34.8% |
| Maximum | 88.5% | 100.0% |
| Range | 74.1% | 65.2% |
| Mean | 49.0% | 47.2% |
| Median | 46.8% | 44.7% |
| Interquartile 25% (IQ1) | 41.2% | 40.8% |
| Interquartile 75% (IQ3) | 53.1% | 49.2% |
| Interquartile Range (IQR) | 11.9% | 8.5% |
| Standard Deviation (Sample) | 14.4% | 10.9% |
| Standard Deviation (Population) | 14.2% | 10.8% |
Similar Demographics by Married-couple Households
Demographics Similar to Immigrants from Venezuela by Married-couple Households
In terms of married-couple households, the demographic groups most similar to Immigrants from Venezuela are Zimbabwean (47.4%, a difference of 0.010%), Australian (47.4%, a difference of 0.030%), Pakistani (47.3%, a difference of 0.060%), Okinawan (47.4%, a difference of 0.080%), and Immigrants from Eastern Europe (47.4%, a difference of 0.10%).
| Demographics | Rating | Rank | Married-couple Households |
| Argentineans | 92.5 /100 | #116 | Exceptional 47.5% |
| French Canadians | 92.4 /100 | #117 | Exceptional 47.5% |
| Immigrants | Germany | 92.4 /100 | #118 | Exceptional 47.5% |
| Chileans | 92.2 /100 | #119 | Exceptional 47.5% |
| Puget Sound Salish | 90.5 /100 | #120 | Exceptional 47.4% |
| Immigrants | Eastern Europe | 90.3 /100 | #121 | Exceptional 47.4% |
| Okinawans | 90.1 /100 | #122 | Exceptional 47.4% |
| Immigrants | Venezuela | 89.3 /100 | #123 | Excellent 47.4% |
| Zimbabweans | 89.2 /100 | #124 | Excellent 47.4% |
| Australians | 89.0 /100 | #125 | Excellent 47.4% |
| Pakistanis | 88.6 /100 | #126 | Excellent 47.3% |
| Celtics | 88.1 /100 | #127 | Excellent 47.3% |
| Immigrants | Peru | 87.9 /100 | #128 | Excellent 47.3% |
| Immigrants | Iraq | 87.8 /100 | #129 | Excellent 47.3% |
| Immigrants | Hungary | 87.8 /100 | #130 | Excellent 47.3% |
Demographics Similar to Immigrants from Ecuador by Married-couple Households
In terms of married-couple households, the demographic groups most similar to Immigrants from Ecuador are Sierra Leonean (42.9%, a difference of 0.050%), Immigrants from Guatemala (42.8%, a difference of 0.070%), Immigrants from Africa (42.9%, a difference of 0.080%), Immigrants from Eastern Africa (42.9%, a difference of 0.19%), and Immigrants from Ethiopia (43.1%, a difference of 0.45%).
| Demographics | Rating | Rank | Married-couple Households |
| Ethiopians | 0.1 /100 | #273 | Tragic 43.2% |
| Nigerians | 0.1 /100 | #274 | Tragic 43.2% |
| Immigrants | Bangladesh | 0.0 /100 | #275 | Tragic 43.1% |
| Immigrants | Ethiopia | 0.0 /100 | #276 | Tragic 43.1% |
| Immigrants | Eastern Africa | 0.0 /100 | #277 | Tragic 42.9% |
| Immigrants | Africa | 0.0 /100 | #278 | Tragic 42.9% |
| Sierra Leoneans | 0.0 /100 | #279 | Tragic 42.9% |
| Immigrants | Ecuador | 0.0 /100 | #280 | Tragic 42.9% |
| Immigrants | Guatemala | 0.0 /100 | #281 | Tragic 42.8% |
| Bermudans | 0.0 /100 | #282 | Tragic 42.4% |
| Inupiat | 0.0 /100 | #283 | Tragic 42.4% |
| Cheyenne | 0.0 /100 | #284 | Tragic 42.3% |
| Ghanaians | 0.0 /100 | #285 | Tragic 42.2% |
| Belizeans | 0.0 /100 | #286 | Tragic 42.2% |
| Chippewa | 0.0 /100 | #287 | Tragic 42.1% |