Nigerian vs Immigrants from Portugal Married-couple Households
COMPARE
Nigerian
Immigrants from Portugal
Married-couple Households
Married-couple Households Comparison
Nigerians
Immigrants from Portugal
43.2%
MARRIED-COUPLE HOUSEHOLDS
0.1/ 100
METRIC RATING
274th/ 347
METRIC RANK
45.2%
MARRIED-COUPLE HOUSEHOLDS
5.6/ 100
METRIC RATING
216th/ 347
METRIC RANK
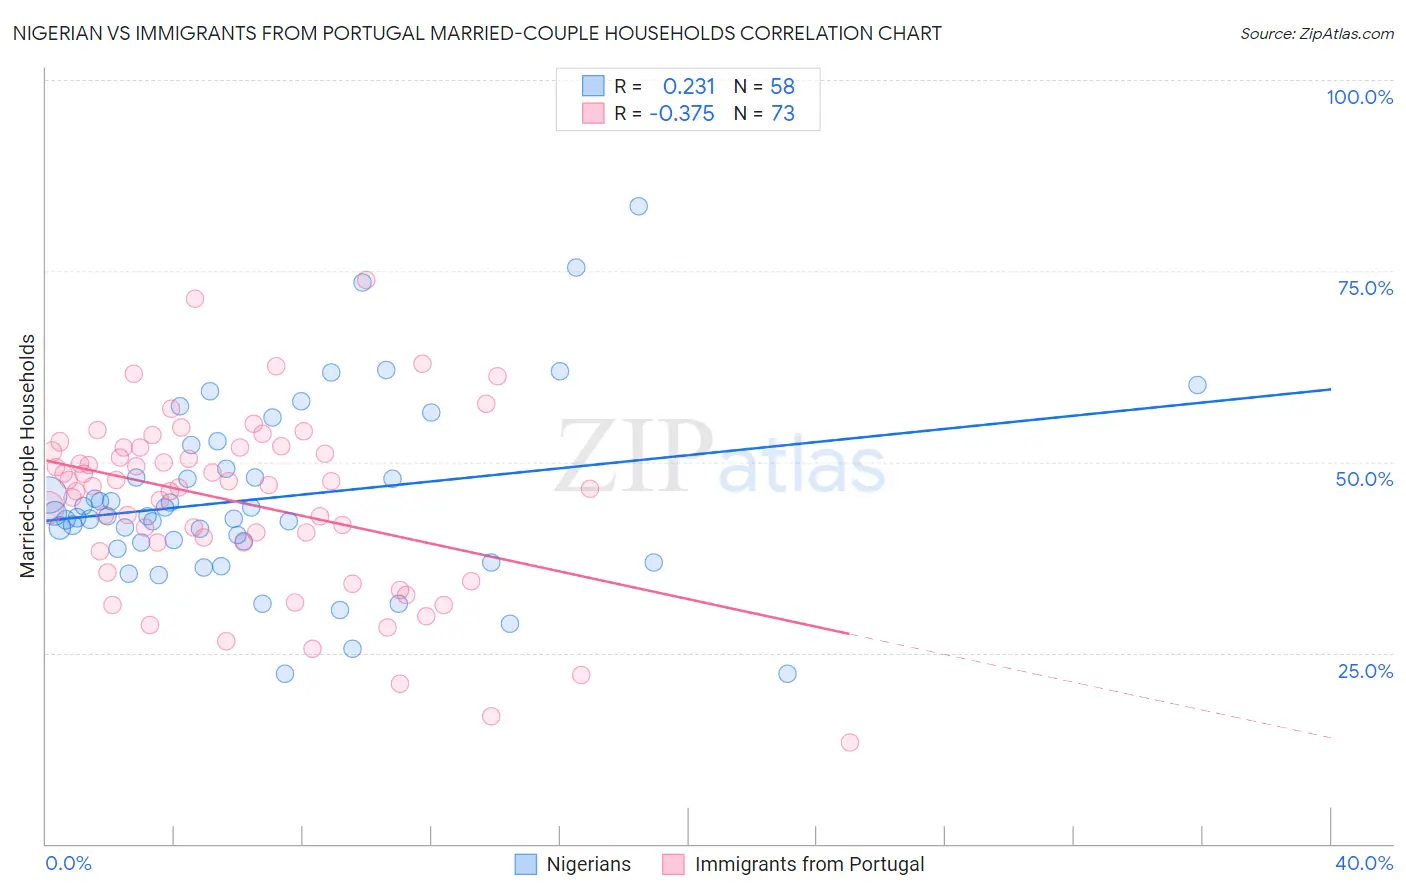
Nigerian vs Immigrants from Portugal Married-couple Households Correlation Chart
The statistical analysis conducted on geographies consisting of 332,444,771 people shows a weak positive correlation between the proportion of Nigerians and percentage of married-couple family households in the United States with a correlation coefficient (R) of 0.231 and weighted average of 43.2%. Similarly, the statistical analysis conducted on geographies consisting of 174,766,894 people shows a mild negative correlation between the proportion of Immigrants from Portugal and percentage of married-couple family households in the United States with a correlation coefficient (R) of -0.375 and weighted average of 45.2%, a difference of 4.8%.
Married-couple Households Correlation Summary
| Measurement | Nigerian | Immigrants from Portugal |
| Minimum | 22.2% | 13.2% |
| Maximum | 83.4% | 73.9% |
| Range | 61.2% | 60.7% |
| Mean | 45.2% | 44.7% |
| Median | 42.9% | 46.8% |
| Interquartile 25% (IQ1) | 39.4% | 38.8% |
| Interquartile 75% (IQ3) | 49.2% | 51.9% |
| Interquartile Range (IQR) | 9.7% | 13.1% |
| Standard Deviation (Sample) | 12.0% | 11.7% |
| Standard Deviation (Population) | 11.9% | 11.6% |
Similar Demographics by Married-couple Households
Demographics Similar to Nigerians by Married-couple Households
In terms of married-couple households, the demographic groups most similar to Nigerians are Ethiopian (43.2%, a difference of 0.010%), Immigrants from Nigeria (43.2%, a difference of 0.11%), Immigrants from Bangladesh (43.1%, a difference of 0.14%), Guatemalan (43.3%, a difference of 0.21%), and Immigrants from Ethiopia (43.1%, a difference of 0.25%).
| Demographics | Rating | Rank | Married-couple Households |
| Natives/Alaskans | 0.1 /100 | #267 | Tragic 43.5% |
| Immigrants | Burma/Myanmar | 0.1 /100 | #268 | Tragic 43.4% |
| Immigrants | Sierra Leone | 0.1 /100 | #269 | Tragic 43.3% |
| Yuman | 0.1 /100 | #270 | Tragic 43.3% |
| Guatemalans | 0.1 /100 | #271 | Tragic 43.3% |
| Immigrants | Nigeria | 0.1 /100 | #272 | Tragic 43.2% |
| Ethiopians | 0.1 /100 | #273 | Tragic 43.2% |
| Nigerians | 0.1 /100 | #274 | Tragic 43.2% |
| Immigrants | Bangladesh | 0.0 /100 | #275 | Tragic 43.1% |
| Immigrants | Ethiopia | 0.0 /100 | #276 | Tragic 43.1% |
| Immigrants | Eastern Africa | 0.0 /100 | #277 | Tragic 42.9% |
| Immigrants | Africa | 0.0 /100 | #278 | Tragic 42.9% |
| Sierra Leoneans | 0.0 /100 | #279 | Tragic 42.9% |
| Immigrants | Ecuador | 0.0 /100 | #280 | Tragic 42.9% |
| Immigrants | Guatemala | 0.0 /100 | #281 | Tragic 42.8% |
Demographics Similar to Immigrants from Portugal by Married-couple Households
In terms of married-couple households, the demographic groups most similar to Immigrants from Portugal are Immigrants from Nepal (45.2%, a difference of 0.0%), Japanese (45.2%, a difference of 0.020%), Panamanian (45.2%, a difference of 0.020%), Yakama (45.2%, a difference of 0.050%), and Immigrants from the Azores (45.2%, a difference of 0.050%).
| Demographics | Rating | Rank | Married-couple Households |
| Immigrants | Uzbekistan | 8.4 /100 | #209 | Tragic 45.4% |
| Cubans | 7.7 /100 | #210 | Tragic 45.4% |
| Immigrants | Spain | 7.3 /100 | #211 | Tragic 45.3% |
| Creek | 6.4 /100 | #212 | Tragic 45.3% |
| Yakama | 5.8 /100 | #213 | Tragic 45.2% |
| Japanese | 5.7 /100 | #214 | Tragic 45.2% |
| Immigrants | Nepal | 5.6 /100 | #215 | Tragic 45.2% |
| Immigrants | Portugal | 5.6 /100 | #216 | Tragic 45.2% |
| Panamanians | 5.5 /100 | #217 | Tragic 45.2% |
| Immigrants | Azores | 5.3 /100 | #218 | Tragic 45.2% |
| Nicaraguans | 5.3 /100 | #219 | Tragic 45.2% |
| Immigrants | Thailand | 5.1 /100 | #220 | Tragic 45.2% |
| Tlingit-Haida | 4.9 /100 | #221 | Tragic 45.1% |
| Immigrants | Laos | 4.6 /100 | #222 | Tragic 45.1% |
| Immigrants | Cambodia | 2.7 /100 | #223 | Tragic 44.9% |