Nigerian vs Lumbee Married-couple Households
COMPARE
Nigerian
Lumbee
Married-couple Households
Married-couple Households Comparison
Nigerians
Lumbee
43.2%
MARRIED-COUPLE HOUSEHOLDS
0.1/ 100
METRIC RATING
274th/ 347
METRIC RANK
39.6%
MARRIED-COUPLE HOUSEHOLDS
0.0/ 100
METRIC RATING
327th/ 347
METRIC RANK
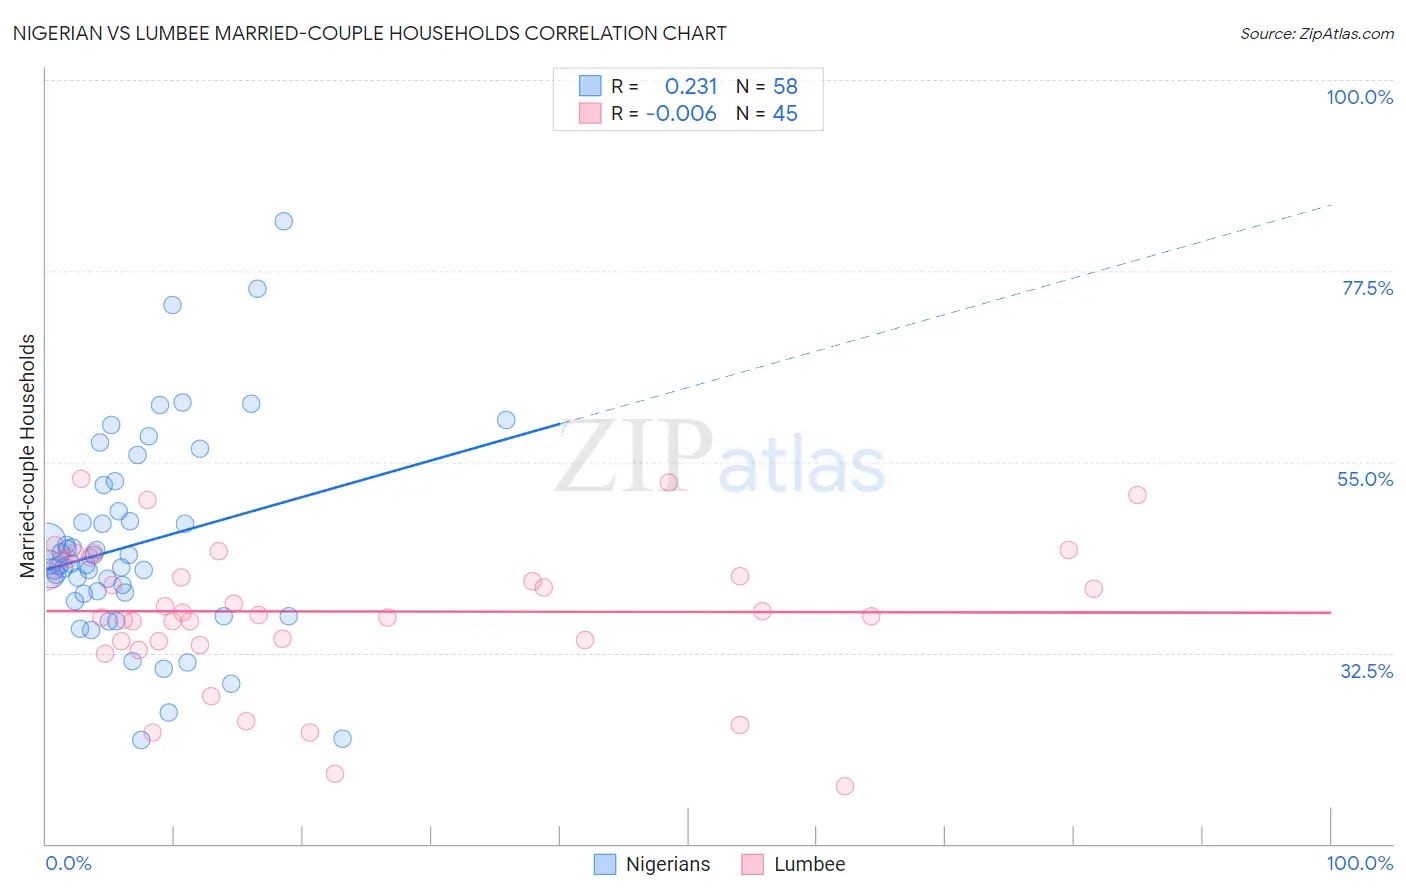
Nigerian vs Lumbee Married-couple Households Correlation Chart
The statistical analysis conducted on geographies consisting of 332,444,771 people shows a weak positive correlation between the proportion of Nigerians and percentage of married-couple family households in the United States with a correlation coefficient (R) of 0.231 and weighted average of 43.2%. Similarly, the statistical analysis conducted on geographies consisting of 92,264,260 people shows no correlation between the proportion of Lumbee and percentage of married-couple family households in the United States with a correlation coefficient (R) of -0.006 and weighted average of 39.6%, a difference of 9.0%.
Married-couple Households Correlation Summary
| Measurement | Nigerian | Lumbee |
| Minimum | 22.2% | 16.8% |
| Maximum | 83.4% | 53.0% |
| Range | 61.2% | 36.2% |
| Mean | 45.2% | 37.4% |
| Median | 42.9% | 37.3% |
| Interquartile 25% (IQ1) | 39.4% | 33.9% |
| Interquartile 75% (IQ3) | 49.2% | 43.5% |
| Interquartile Range (IQR) | 9.7% | 9.7% |
| Standard Deviation (Sample) | 12.0% | 8.3% |
| Standard Deviation (Population) | 11.9% | 8.2% |
Similar Demographics by Married-couple Households
Demographics Similar to Nigerians by Married-couple Households
In terms of married-couple households, the demographic groups most similar to Nigerians are Ethiopian (43.2%, a difference of 0.010%), Immigrants from Nigeria (43.2%, a difference of 0.11%), Immigrants from Bangladesh (43.1%, a difference of 0.14%), Guatemalan (43.3%, a difference of 0.21%), and Immigrants from Ethiopia (43.1%, a difference of 0.25%).
| Demographics | Rating | Rank | Married-couple Households |
| Natives/Alaskans | 0.1 /100 | #267 | Tragic 43.5% |
| Immigrants | Burma/Myanmar | 0.1 /100 | #268 | Tragic 43.4% |
| Immigrants | Sierra Leone | 0.1 /100 | #269 | Tragic 43.3% |
| Yuman | 0.1 /100 | #270 | Tragic 43.3% |
| Guatemalans | 0.1 /100 | #271 | Tragic 43.3% |
| Immigrants | Nigeria | 0.1 /100 | #272 | Tragic 43.2% |
| Ethiopians | 0.1 /100 | #273 | Tragic 43.2% |
| Nigerians | 0.1 /100 | #274 | Tragic 43.2% |
| Immigrants | Bangladesh | 0.0 /100 | #275 | Tragic 43.1% |
| Immigrants | Ethiopia | 0.0 /100 | #276 | Tragic 43.1% |
| Immigrants | Eastern Africa | 0.0 /100 | #277 | Tragic 42.9% |
| Immigrants | Africa | 0.0 /100 | #278 | Tragic 42.9% |
| Sierra Leoneans | 0.0 /100 | #279 | Tragic 42.9% |
| Immigrants | Ecuador | 0.0 /100 | #280 | Tragic 42.9% |
| Immigrants | Guatemala | 0.0 /100 | #281 | Tragic 42.8% |
Demographics Similar to Lumbee by Married-couple Households
In terms of married-couple households, the demographic groups most similar to Lumbee are U.S. Virgin Islander (39.8%, a difference of 0.47%), Barbadian (39.4%, a difference of 0.50%), Immigrants from Dominica (39.4%, a difference of 0.57%), Pueblo (40.0%, a difference of 0.93%), and Immigrants from Barbados (39.2%, a difference of 1.0%).
| Demographics | Rating | Rank | Married-couple Households |
| West Indians | 0.0 /100 | #320 | Tragic 40.3% |
| Immigrants | Liberia | 0.0 /100 | #321 | Tragic 40.3% |
| Immigrants | Zaire | 0.0 /100 | #322 | Tragic 40.1% |
| Puerto Ricans | 0.0 /100 | #323 | Tragic 40.1% |
| Navajo | 0.0 /100 | #324 | Tragic 40.1% |
| Pueblo | 0.0 /100 | #325 | Tragic 40.0% |
| U.S. Virgin Islanders | 0.0 /100 | #326 | Tragic 39.8% |
| Lumbee | 0.0 /100 | #327 | Tragic 39.6% |
| Barbadians | 0.0 /100 | #328 | Tragic 39.4% |
| Immigrants | Dominica | 0.0 /100 | #329 | Tragic 39.4% |
| Immigrants | Barbados | 0.0 /100 | #330 | Tragic 39.2% |
| Immigrants | Congo | 0.0 /100 | #331 | Tragic 39.0% |
| Somalis | 0.0 /100 | #332 | Tragic 39.0% |
| Immigrants | West Indies | 0.0 /100 | #333 | Tragic 39.0% |
| Immigrants | St. Vincent and the Grenadines | 0.0 /100 | #334 | Tragic 38.7% |