Maltese vs Immigrants from Sri Lanka Married-couple Households
COMPARE
Maltese
Immigrants from Sri Lanka
Married-couple Households
Married-couple Households Comparison
Maltese
Immigrants from Sri Lanka
49.2%
MARRIED-COUPLE HOUSEHOLDS
99.8/ 100
METRIC RATING
29th/ 347
METRIC RANK
48.7%
MARRIED-COUPLE HOUSEHOLDS
99.4/ 100
METRIC RATING
49th/ 347
METRIC RANK
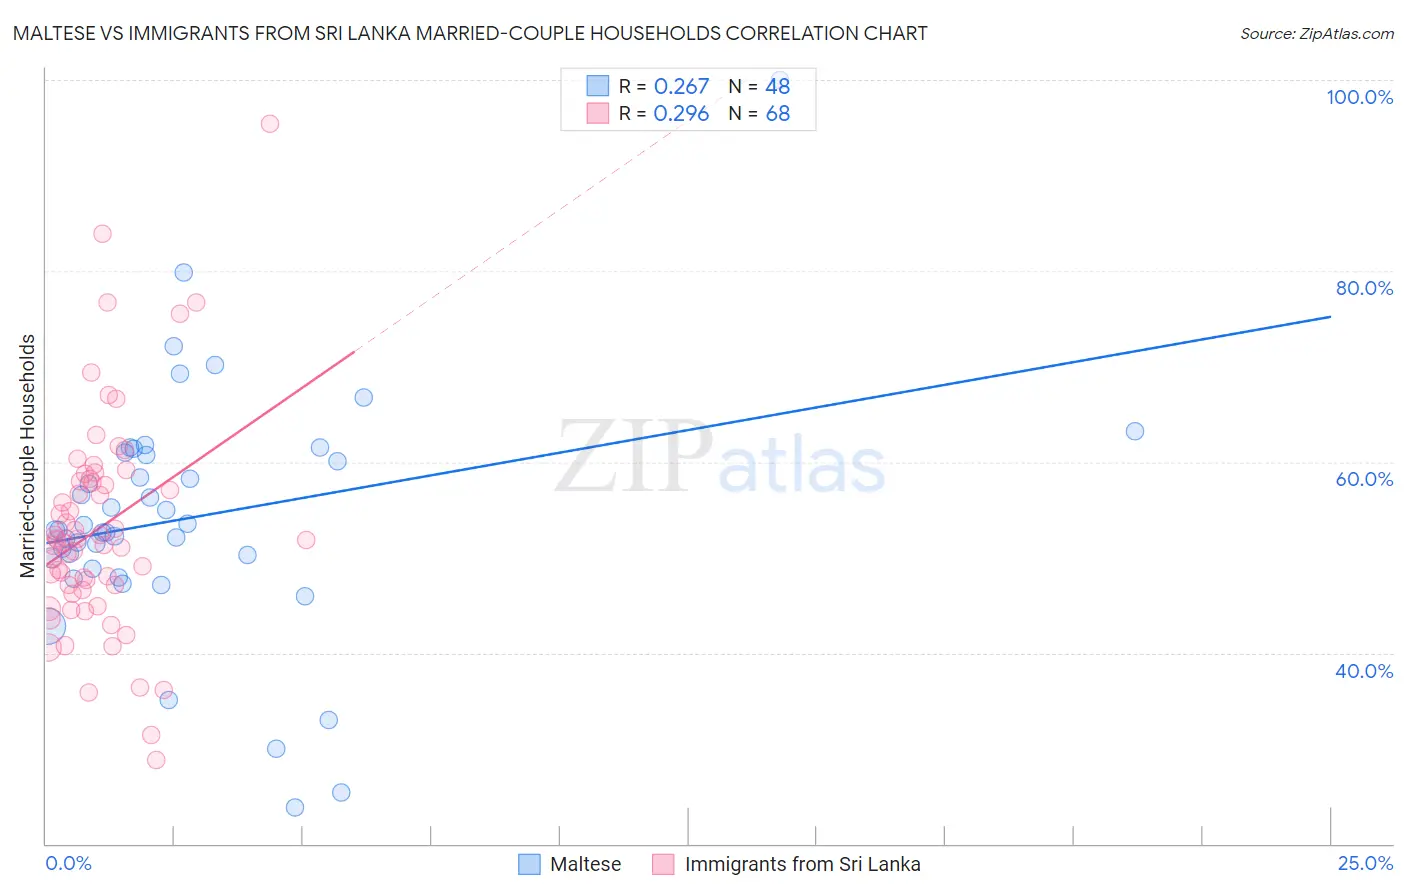
Maltese vs Immigrants from Sri Lanka Married-couple Households Correlation Chart
The statistical analysis conducted on geographies consisting of 126,420,925 people shows a weak positive correlation between the proportion of Maltese and percentage of married-couple family households in the United States with a correlation coefficient (R) of 0.267 and weighted average of 49.2%. Similarly, the statistical analysis conducted on geographies consisting of 149,682,536 people shows a weak positive correlation between the proportion of Immigrants from Sri Lanka and percentage of married-couple family households in the United States with a correlation coefficient (R) of 0.296 and weighted average of 48.7%, a difference of 1.0%.
Married-couple Households Correlation Summary
| Measurement | Maltese | Immigrants from Sri Lanka |
| Minimum | 23.8% | 28.8% |
| Maximum | 100.0% | 95.4% |
| Range | 76.2% | 66.7% |
| Mean | 54.2% | 53.1% |
| Median | 52.9% | 51.8% |
| Interquartile 25% (IQ1) | 49.4% | 46.8% |
| Interquartile 75% (IQ3) | 60.8% | 58.1% |
| Interquartile Range (IQR) | 11.5% | 11.3% |
| Standard Deviation (Sample) | 12.9% | 11.6% |
| Standard Deviation (Population) | 12.8% | 11.5% |
Demographics Similar to Maltese and Immigrants from Sri Lanka by Married-couple Households
In terms of married-couple households, the demographic groups most similar to Maltese are Bolivian (49.2%, a difference of 0.020%), Native Hawaiian (49.1%, a difference of 0.12%), Hungarian (49.1%, a difference of 0.18%), Immigrants from Asia (49.1%, a difference of 0.22%), and Italian (49.0%, a difference of 0.29%). Similarly, the demographic groups most similar to Immigrants from Sri Lanka are Indian (Asian) (48.7%, a difference of 0.060%), British (48.7%, a difference of 0.12%), Tsimshian (48.7%, a difference of 0.13%), Immigrants from Eastern Asia (48.8%, a difference of 0.18%), and Welsh (48.8%, a difference of 0.21%).
| Demographics | Rating | Rank | Married-couple Households |
| Maltese | 99.8 /100 | #29 | Exceptional 49.2% |
| Bolivians | 99.8 /100 | #30 | Exceptional 49.2% |
| Native Hawaiians | 99.8 /100 | #31 | Exceptional 49.1% |
| Hungarians | 99.8 /100 | #32 | Exceptional 49.1% |
| Immigrants | Asia | 99.7 /100 | #33 | Exceptional 49.1% |
| Italians | 99.7 /100 | #34 | Exceptional 49.0% |
| Scottish | 99.7 /100 | #35 | Exceptional 49.0% |
| Iranians | 99.7 /100 | #36 | Exceptional 49.0% |
| Sri Lankans | 99.7 /100 | #37 | Exceptional 49.0% |
| Greeks | 99.7 /100 | #38 | Exceptional 48.9% |
| Lithuanians | 99.6 /100 | #39 | Exceptional 48.9% |
| Immigrants | Bolivia | 99.6 /100 | #40 | Exceptional 48.9% |
| Immigrants | Lebanon | 99.6 /100 | #41 | Exceptional 48.9% |
| Immigrants | Vietnam | 99.6 /100 | #42 | Exceptional 48.8% |
| Immigrants | Iran | 99.6 /100 | #43 | Exceptional 48.8% |
| Welsh | 99.5 /100 | #44 | Exceptional 48.8% |
| Immigrants | Eastern Asia | 99.5 /100 | #45 | Exceptional 48.8% |
| Tsimshian | 99.5 /100 | #46 | Exceptional 48.7% |
| British | 99.5 /100 | #47 | Exceptional 48.7% |
| Indians (Asian) | 99.4 /100 | #48 | Exceptional 48.7% |
| Immigrants | Sri Lanka | 99.4 /100 | #49 | Exceptional 48.7% |