Danish vs Immigrants from Sri Lanka Married-couple Households
COMPARE
Danish
Immigrants from Sri Lanka
Married-couple Households
Married-couple Households Comparison
Danes
Immigrants from Sri Lanka
51.1%
MARRIED-COUPLE HOUSEHOLDS
100.0/ 100
METRIC RATING
6th/ 347
METRIC RANK
48.7%
MARRIED-COUPLE HOUSEHOLDS
99.4/ 100
METRIC RATING
49th/ 347
METRIC RANK
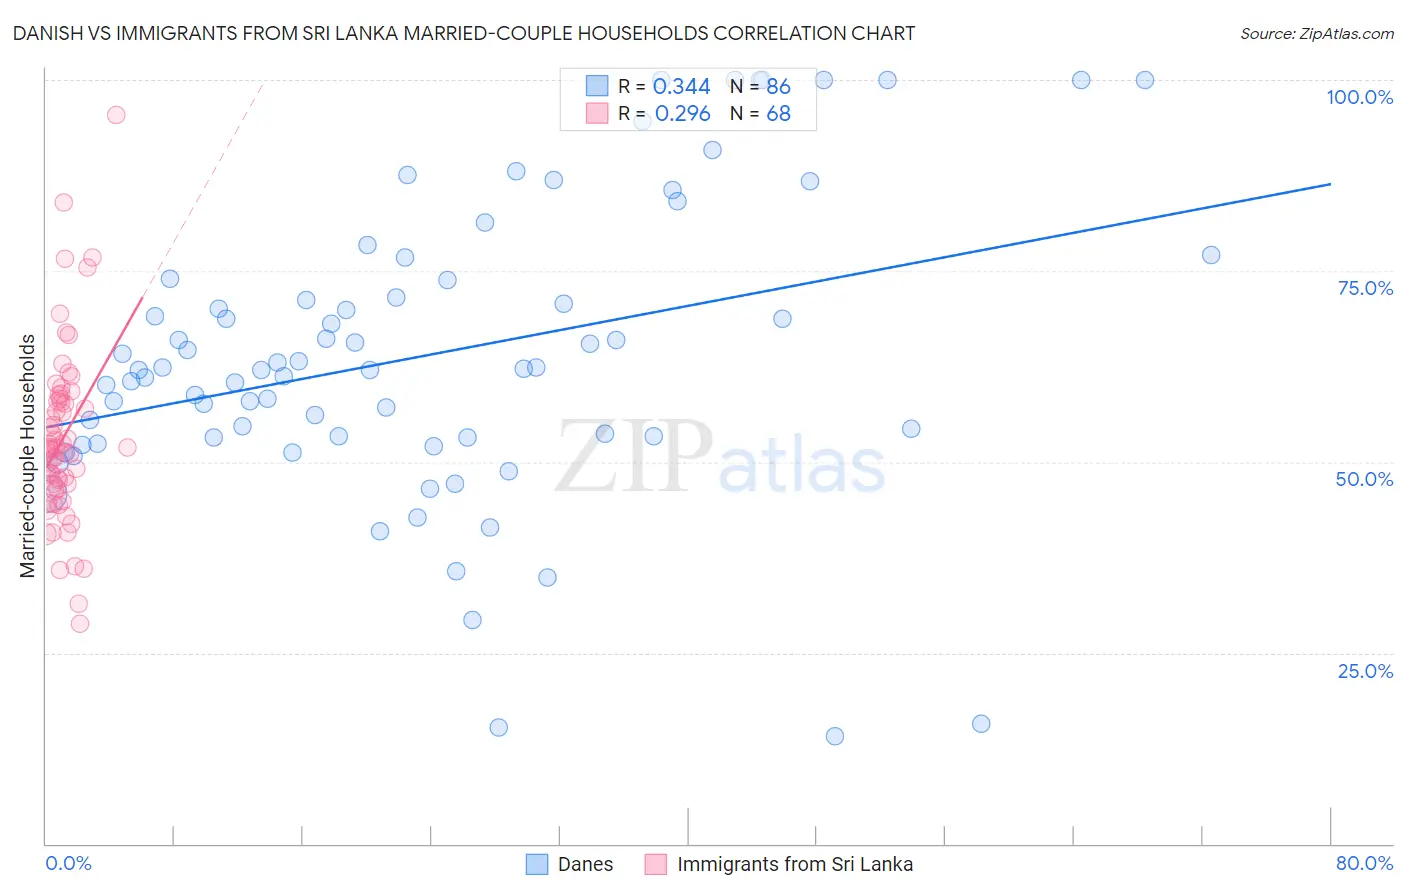
Danish vs Immigrants from Sri Lanka Married-couple Households Correlation Chart
The statistical analysis conducted on geographies consisting of 473,893,305 people shows a mild positive correlation between the proportion of Danes and percentage of married-couple family households in the United States with a correlation coefficient (R) of 0.344 and weighted average of 51.1%. Similarly, the statistical analysis conducted on geographies consisting of 149,682,536 people shows a weak positive correlation between the proportion of Immigrants from Sri Lanka and percentage of married-couple family households in the United States with a correlation coefficient (R) of 0.296 and weighted average of 48.7%, a difference of 4.9%.
Married-couple Households Correlation Summary
| Measurement | Danish | Immigrants from Sri Lanka |
| Minimum | 14.0% | 28.8% |
| Maximum | 100.0% | 95.4% |
| Range | 86.0% | 66.7% |
| Mean | 64.0% | 53.1% |
| Median | 62.1% | 51.8% |
| Interquartile 25% (IQ1) | 53.2% | 46.8% |
| Interquartile 75% (IQ3) | 73.9% | 58.1% |
| Interquartile Range (IQR) | 20.6% | 11.3% |
| Standard Deviation (Sample) | 19.2% | 11.6% |
| Standard Deviation (Population) | 19.1% | 11.5% |
Similar Demographics by Married-couple Households
Demographics Similar to Danes by Married-couple Households
In terms of married-couple households, the demographic groups most similar to Danes are Filipino (51.0%, a difference of 0.22%), Immigrants from South Central Asia (50.6%, a difference of 0.86%), Tongan (51.6%, a difference of 0.98%), Pennsylvania German (50.4%, a difference of 1.4%), and Chinese (50.4%, a difference of 1.4%).
| Demographics | Rating | Rank | Married-couple Households |
| Immigrants | India | 100.0 /100 | #1 | Exceptional 52.7% |
| Immigrants | Taiwan | 100.0 /100 | #2 | Exceptional 52.4% |
| Thais | 100.0 /100 | #3 | Exceptional 51.9% |
| Assyrians/Chaldeans/Syriacs | 100.0 /100 | #4 | Exceptional 51.8% |
| Tongans | 100.0 /100 | #5 | Exceptional 51.6% |
| Danes | 100.0 /100 | #6 | Exceptional 51.1% |
| Filipinos | 100.0 /100 | #7 | Exceptional 51.0% |
| Immigrants | South Central Asia | 100.0 /100 | #8 | Exceptional 50.6% |
| Pennsylvania Germans | 100.0 /100 | #9 | Exceptional 50.4% |
| Chinese | 100.0 /100 | #10 | Exceptional 50.4% |
| Immigrants | Pakistan | 100.0 /100 | #11 | Exceptional 50.1% |
| Swiss | 100.0 /100 | #12 | Exceptional 49.9% |
| Immigrants | Korea | 100.0 /100 | #13 | Exceptional 49.9% |
| Burmese | 100.0 /100 | #14 | Exceptional 49.8% |
| Koreans | 99.9 /100 | #15 | Exceptional 49.7% |
Demographics Similar to Immigrants from Sri Lanka by Married-couple Households
In terms of married-couple households, the demographic groups most similar to Immigrants from Sri Lanka are Samoan (48.7%, a difference of 0.040%), Indian (Asian) (48.7%, a difference of 0.060%), Eastern European (48.6%, a difference of 0.080%), British (48.7%, a difference of 0.12%), and Irish (48.6%, a difference of 0.12%).
| Demographics | Rating | Rank | Married-couple Households |
| Immigrants | Vietnam | 99.6 /100 | #42 | Exceptional 48.8% |
| Immigrants | Iran | 99.6 /100 | #43 | Exceptional 48.8% |
| Welsh | 99.5 /100 | #44 | Exceptional 48.8% |
| Immigrants | Eastern Asia | 99.5 /100 | #45 | Exceptional 48.8% |
| Tsimshian | 99.5 /100 | #46 | Exceptional 48.7% |
| British | 99.5 /100 | #47 | Exceptional 48.7% |
| Indians (Asian) | 99.4 /100 | #48 | Exceptional 48.7% |
| Immigrants | Sri Lanka | 99.4 /100 | #49 | Exceptional 48.7% |
| Samoans | 99.4 /100 | #50 | Exceptional 48.7% |
| Eastern Europeans | 99.3 /100 | #51 | Exceptional 48.6% |
| Irish | 99.3 /100 | #52 | Exceptional 48.6% |
| Whites/Caucasians | 99.3 /100 | #53 | Exceptional 48.6% |
| Immigrants | Lithuania | 99.3 /100 | #54 | Exceptional 48.6% |
| Austrians | 99.3 /100 | #55 | Exceptional 48.6% |
| Immigrants | Northern Europe | 99.3 /100 | #56 | Exceptional 48.6% |