Maltese vs New Zealander Married-couple Households
COMPARE
Maltese
New Zealander
Married-couple Households
Married-couple Households Comparison
Maltese
New Zealanders
49.2%
MARRIED-COUPLE HOUSEHOLDS
99.8/ 100
METRIC RATING
29th/ 347
METRIC RANK
47.2%
MARRIED-COUPLE HOUSEHOLDS
85.3/ 100
METRIC RATING
136th/ 347
METRIC RANK
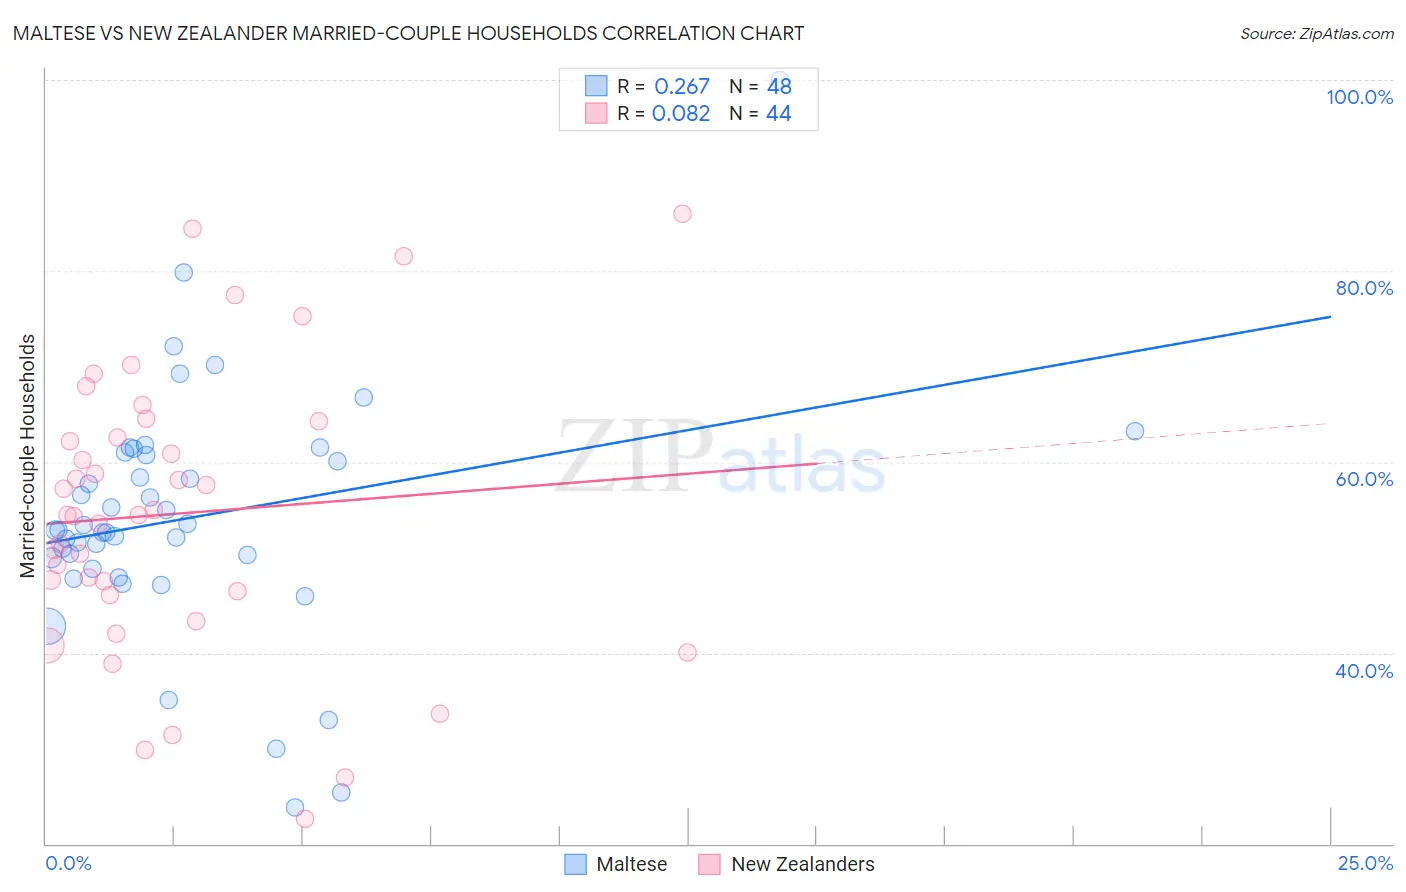
Maltese vs New Zealander Married-couple Households Correlation Chart
The statistical analysis conducted on geographies consisting of 126,420,925 people shows a weak positive correlation between the proportion of Maltese and percentage of married-couple family households in the United States with a correlation coefficient (R) of 0.267 and weighted average of 49.2%. Similarly, the statistical analysis conducted on geographies consisting of 106,894,441 people shows a slight positive correlation between the proportion of New Zealanders and percentage of married-couple family households in the United States with a correlation coefficient (R) of 0.082 and weighted average of 47.2%, a difference of 4.1%.
Married-couple Households Correlation Summary
| Measurement | Maltese | New Zealander |
| Minimum | 23.8% | 22.7% |
| Maximum | 100.0% | 86.0% |
| Range | 76.2% | 63.3% |
| Mean | 54.2% | 54.6% |
| Median | 52.9% | 54.4% |
| Interquartile 25% (IQ1) | 49.4% | 46.3% |
| Interquartile 75% (IQ3) | 60.8% | 63.4% |
| Interquartile Range (IQR) | 11.5% | 17.2% |
| Standard Deviation (Sample) | 12.9% | 14.8% |
| Standard Deviation (Population) | 12.8% | 14.6% |
Similar Demographics by Married-couple Households
Demographics Similar to Maltese by Married-couple Households
In terms of married-couple households, the demographic groups most similar to Maltese are German (49.2%, a difference of 0.010%), Bolivian (49.2%, a difference of 0.020%), Native Hawaiian (49.1%, a difference of 0.12%), Hungarian (49.1%, a difference of 0.18%), and Bhutanese (49.3%, a difference of 0.20%).
| Demographics | Rating | Rank | Married-couple Households |
| Asians | 99.9 /100 | #22 | Exceptional 49.5% |
| Dutch | 99.9 /100 | #23 | Exceptional 49.5% |
| Czechs | 99.9 /100 | #24 | Exceptional 49.4% |
| Immigrants | Philippines | 99.9 /100 | #25 | Exceptional 49.3% |
| Immigrants | Scotland | 99.8 /100 | #26 | Exceptional 49.3% |
| Bhutanese | 99.8 /100 | #27 | Exceptional 49.3% |
| Germans | 99.8 /100 | #28 | Exceptional 49.2% |
| Maltese | 99.8 /100 | #29 | Exceptional 49.2% |
| Bolivians | 99.8 /100 | #30 | Exceptional 49.2% |
| Native Hawaiians | 99.8 /100 | #31 | Exceptional 49.1% |
| Hungarians | 99.8 /100 | #32 | Exceptional 49.1% |
| Immigrants | Asia | 99.7 /100 | #33 | Exceptional 49.1% |
| Italians | 99.7 /100 | #34 | Exceptional 49.0% |
| Scottish | 99.7 /100 | #35 | Exceptional 49.0% |
| Iranians | 99.7 /100 | #36 | Exceptional 49.0% |
Demographics Similar to New Zealanders by Married-couple Households
In terms of married-couple households, the demographic groups most similar to New Zealanders are Immigrants from Malaysia (47.2%, a difference of 0.0%), Immigrants from Afghanistan (47.2%, a difference of 0.010%), Immigrants from Sweden (47.2%, a difference of 0.040%), Immigrants from Greece (47.2%, a difference of 0.050%), and Immigrants from Argentina (47.2%, a difference of 0.050%).
| Demographics | Rating | Rank | Married-couple Households |
| Immigrants | Iraq | 87.8 /100 | #129 | Excellent 47.3% |
| Immigrants | Hungary | 87.8 /100 | #130 | Excellent 47.3% |
| Immigrants | Denmark | 87.5 /100 | #131 | Excellent 47.3% |
| Immigrants | Ukraine | 86.7 /100 | #132 | Excellent 47.3% |
| South Africans | 86.4 /100 | #133 | Excellent 47.3% |
| Immigrants | Greece | 86.0 /100 | #134 | Excellent 47.2% |
| Immigrants | Argentina | 86.0 /100 | #135 | Excellent 47.2% |
| New Zealanders | 85.3 /100 | #136 | Excellent 47.2% |
| Immigrants | Malaysia | 85.2 /100 | #137 | Excellent 47.2% |
| Immigrants | Afghanistan | 85.1 /100 | #138 | Excellent 47.2% |
| Immigrants | Sweden | 84.7 /100 | #139 | Excellent 47.2% |
| Spanish | 84.5 /100 | #140 | Excellent 47.2% |
| Costa Ricans | 84.4 /100 | #141 | Excellent 47.2% |
| Spaniards | 84.1 /100 | #142 | Excellent 47.2% |
| Immigrants | Belarus | 83.8 /100 | #143 | Excellent 47.2% |