Immigrants from France vs Yugoslavian Married-couple Households
COMPARE
Immigrants from France
Yugoslavian
Married-couple Households
Married-couple Households Comparison
Immigrants from France
Yugoslavians
45.4%
MARRIED-COUPLE HOUSEHOLDS
8.8/ 100
METRIC RATING
207th/ 347
METRIC RANK
46.2%
MARRIED-COUPLE HOUSEHOLDS
38.9/ 100
METRIC RATING
182nd/ 347
METRIC RANK
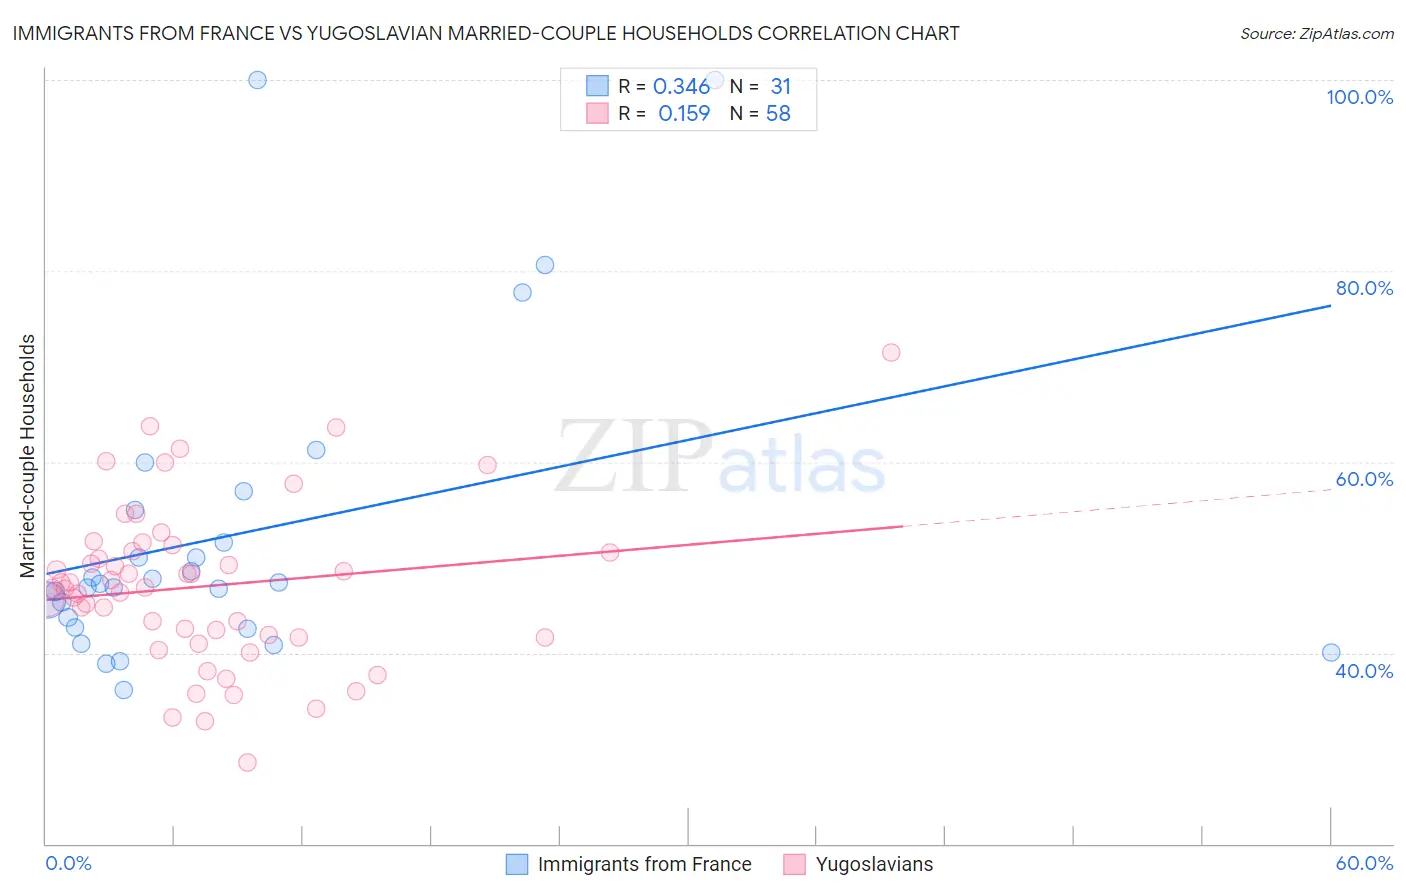
Immigrants from France vs Yugoslavian Married-couple Households Correlation Chart
The statistical analysis conducted on geographies consisting of 287,855,925 people shows a mild positive correlation between the proportion of Immigrants from France and percentage of married-couple family households in the United States with a correlation coefficient (R) of 0.346 and weighted average of 45.4%. Similarly, the statistical analysis conducted on geographies consisting of 285,634,197 people shows a poor positive correlation between the proportion of Yugoslavians and percentage of married-couple family households in the United States with a correlation coefficient (R) of 0.159 and weighted average of 46.2%, a difference of 1.8%.
Married-couple Households Correlation Summary
| Measurement | Immigrants from France | Yugoslavian |
| Minimum | 36.1% | 28.5% |
| Maximum | 100.0% | 71.4% |
| Range | 63.9% | 42.9% |
| Mean | 52.4% | 47.0% |
| Median | 47.2% | 46.8% |
| Interquartile 25% (IQ1) | 42.6% | 41.7% |
| Interquartile 75% (IQ3) | 54.9% | 50.6% |
| Interquartile Range (IQR) | 12.3% | 9.0% |
| Standard Deviation (Sample) | 16.1% | 8.5% |
| Standard Deviation (Population) | 15.9% | 8.4% |
Similar Demographics by Married-couple Households
Demographics Similar to Immigrants from France by Married-couple Households
In terms of married-couple households, the demographic groups most similar to Immigrants from France are Hispanic or Latino (45.4%, a difference of 0.010%), Immigrants from Uzbekistan (45.4%, a difference of 0.050%), Cuban (45.4%, a difference of 0.14%), Uruguayan (45.5%, a difference of 0.18%), and Immigrants from Spain (45.3%, a difference of 0.19%).
| Demographics | Rating | Rank | Married-couple Households |
| Potawatomi | 15.6 /100 | #200 | Poor 45.7% |
| Immigrants | Serbia | 15.2 /100 | #201 | Poor 45.7% |
| Immigrants | Central America | 14.2 /100 | #202 | Poor 45.7% |
| Alaska Natives | 13.0 /100 | #203 | Poor 45.6% |
| Aleuts | 12.5 /100 | #204 | Poor 45.6% |
| Nepalese | 11.9 /100 | #205 | Poor 45.6% |
| Uruguayans | 10.4 /100 | #206 | Poor 45.5% |
| Immigrants | France | 8.8 /100 | #207 | Tragic 45.4% |
| Hispanics or Latinos | 8.7 /100 | #208 | Tragic 45.4% |
| Immigrants | Uzbekistan | 8.4 /100 | #209 | Tragic 45.4% |
| Cubans | 7.7 /100 | #210 | Tragic 45.4% |
| Immigrants | Spain | 7.3 /100 | #211 | Tragic 45.3% |
| Creek | 6.4 /100 | #212 | Tragic 45.3% |
| Yakama | 5.8 /100 | #213 | Tragic 45.2% |
| Japanese | 5.7 /100 | #214 | Tragic 45.2% |
Demographics Similar to Yugoslavians by Married-couple Households
In terms of married-couple households, the demographic groups most similar to Yugoslavians are Immigrants from Brazil (46.2%, a difference of 0.020%), Immigrants from Switzerland (46.2%, a difference of 0.080%), Mongolian (46.3%, a difference of 0.12%), Malaysian (46.3%, a difference of 0.12%), and Brazilian (46.2%, a difference of 0.12%).
| Demographics | Rating | Rank | Married-couple Households |
| Immigrants | Colombia | 46.1 /100 | #175 | Average 46.4% |
| Cajuns | 45.2 /100 | #176 | Average 46.4% |
| Immigrants | Immigrants | 43.8 /100 | #177 | Average 46.3% |
| Immigrants | Costa Rica | 43.4 /100 | #178 | Average 46.3% |
| Immigrants | Zimbabwe | 43.0 /100 | #179 | Average 46.3% |
| Mongolians | 42.0 /100 | #180 | Average 46.3% |
| Malaysians | 41.8 /100 | #181 | Average 46.3% |
| Yugoslavians | 38.9 /100 | #182 | Fair 46.2% |
| Immigrants | Brazil | 38.3 /100 | #183 | Fair 46.2% |
| Immigrants | Switzerland | 36.9 /100 | #184 | Fair 46.2% |
| Brazilians | 35.9 /100 | #185 | Fair 46.2% |
| Albanians | 31.1 /100 | #186 | Fair 46.1% |
| Fijians | 29.2 /100 | #187 | Fair 46.1% |
| South American Indians | 28.4 /100 | #188 | Fair 46.0% |
| Immigrants | Latvia | 26.9 /100 | #189 | Fair 46.0% |