Immigrants from Caribbean vs Yugoslavian Married-couple Households
COMPARE
Immigrants from Caribbean
Yugoslavian
Married-couple Households
Married-couple Households Comparison
Immigrants from Caribbean
Yugoslavians
40.8%
MARRIED-COUPLE HOUSEHOLDS
0.0/ 100
METRIC RATING
316th/ 347
METRIC RANK
46.2%
MARRIED-COUPLE HOUSEHOLDS
38.9/ 100
METRIC RATING
182nd/ 347
METRIC RANK
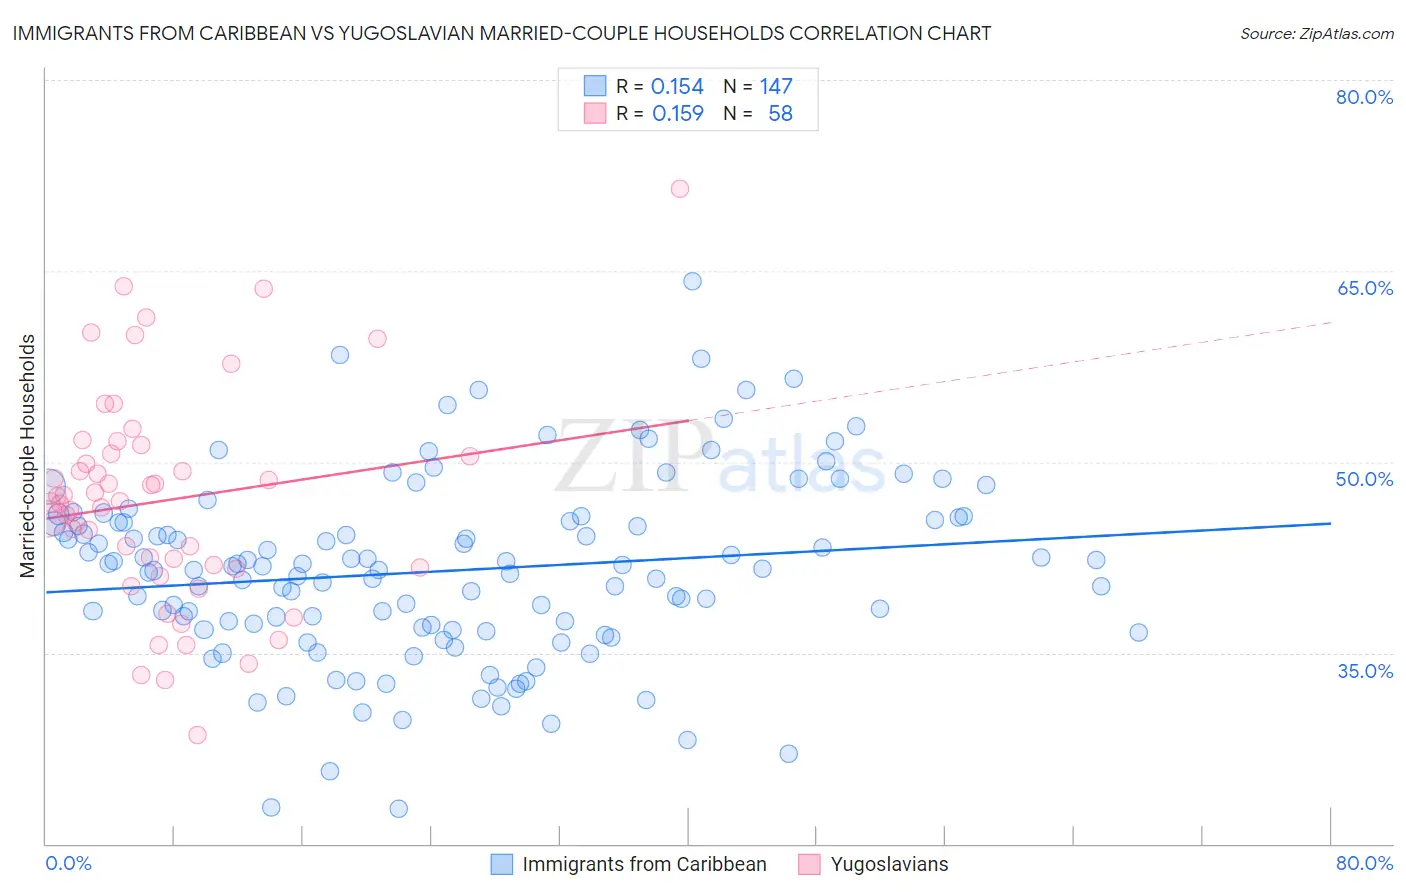
Immigrants from Caribbean vs Yugoslavian Married-couple Households Correlation Chart
The statistical analysis conducted on geographies consisting of 449,664,871 people shows a poor positive correlation between the proportion of Immigrants from Caribbean and percentage of married-couple family households in the United States with a correlation coefficient (R) of 0.154 and weighted average of 40.8%. Similarly, the statistical analysis conducted on geographies consisting of 285,634,197 people shows a poor positive correlation between the proportion of Yugoslavians and percentage of married-couple family households in the United States with a correlation coefficient (R) of 0.159 and weighted average of 46.2%, a difference of 13.4%.
Married-couple Households Correlation Summary
| Measurement | Immigrants from Caribbean | Yugoslavian |
| Minimum | 22.8% | 28.5% |
| Maximum | 64.2% | 71.4% |
| Range | 41.4% | 42.9% |
| Mean | 41.4% | 47.0% |
| Median | 41.7% | 46.8% |
| Interquartile 25% (IQ1) | 36.8% | 41.7% |
| Interquartile 75% (IQ3) | 45.4% | 50.6% |
| Interquartile Range (IQR) | 8.5% | 9.0% |
| Standard Deviation (Sample) | 7.2% | 8.5% |
| Standard Deviation (Population) | 7.1% | 8.4% |
Similar Demographics by Married-couple Households
Demographics Similar to Immigrants from Caribbean by Married-couple Households
In terms of married-couple households, the demographic groups most similar to Immigrants from Caribbean are Trinidadian and Tobagonian (40.9%, a difference of 0.18%), Jamaican (40.9%, a difference of 0.26%), Immigrants from Jamaica (40.7%, a difference of 0.29%), Liberian (40.7%, a difference of 0.30%), and Immigrants from Haiti (40.9%, a difference of 0.34%).
| Demographics | Rating | Rank | Married-couple Households |
| Immigrants | Trinidad and Tobago | 0.0 /100 | #309 | Tragic 41.2% |
| Haitians | 0.0 /100 | #310 | Tragic 41.2% |
| Colville | 0.0 /100 | #311 | Tragic 41.0% |
| Africans | 0.0 /100 | #312 | Tragic 40.9% |
| Immigrants | Haiti | 0.0 /100 | #313 | Tragic 40.9% |
| Jamaicans | 0.0 /100 | #314 | Tragic 40.9% |
| Trinidadians and Tobagonians | 0.0 /100 | #315 | Tragic 40.9% |
| Immigrants | Caribbean | 0.0 /100 | #316 | Tragic 40.8% |
| Immigrants | Jamaica | 0.0 /100 | #317 | Tragic 40.7% |
| Liberians | 0.0 /100 | #318 | Tragic 40.7% |
| Bahamians | 0.0 /100 | #319 | Tragic 40.5% |
| West Indians | 0.0 /100 | #320 | Tragic 40.3% |
| Immigrants | Liberia | 0.0 /100 | #321 | Tragic 40.3% |
| Immigrants | Zaire | 0.0 /100 | #322 | Tragic 40.1% |
| Puerto Ricans | 0.0 /100 | #323 | Tragic 40.1% |
Demographics Similar to Yugoslavians by Married-couple Households
In terms of married-couple households, the demographic groups most similar to Yugoslavians are Immigrants from Brazil (46.2%, a difference of 0.020%), Immigrants from Switzerland (46.2%, a difference of 0.080%), Mongolian (46.3%, a difference of 0.12%), Malaysian (46.3%, a difference of 0.12%), and Brazilian (46.2%, a difference of 0.12%).
| Demographics | Rating | Rank | Married-couple Households |
| Immigrants | Colombia | 46.1 /100 | #175 | Average 46.4% |
| Cajuns | 45.2 /100 | #176 | Average 46.4% |
| Immigrants | Immigrants | 43.8 /100 | #177 | Average 46.3% |
| Immigrants | Costa Rica | 43.4 /100 | #178 | Average 46.3% |
| Immigrants | Zimbabwe | 43.0 /100 | #179 | Average 46.3% |
| Mongolians | 42.0 /100 | #180 | Average 46.3% |
| Malaysians | 41.8 /100 | #181 | Average 46.3% |
| Yugoslavians | 38.9 /100 | #182 | Fair 46.2% |
| Immigrants | Brazil | 38.3 /100 | #183 | Fair 46.2% |
| Immigrants | Switzerland | 36.9 /100 | #184 | Fair 46.2% |
| Brazilians | 35.9 /100 | #185 | Fair 46.2% |
| Albanians | 31.1 /100 | #186 | Fair 46.1% |
| Fijians | 29.2 /100 | #187 | Fair 46.1% |
| South American Indians | 28.4 /100 | #188 | Fair 46.0% |
| Immigrants | Latvia | 26.9 /100 | #189 | Fair 46.0% |