Immigrants from France vs Serbian Married-couple Households

COMPARE

Immigrants from France
Race
Ancestry
AfghanAfricanAlaska NativeAlaskan AthabascanAlbanianAleutAlsatianAmericanApacheArabArapahoArgentineanArmenianAssyrian/Chaldean/SyriacAustralianAustrianBahamianBangladeshiBarbadianBasqueBelgianBelizeanBermudanBhutaneseBlackfeetBolivianBrazilianBritishBritish West IndianBulgarianBurmeseCajunCambodianCanadianCape VerdeanCarpatho RusynCelticCentral AmericanCentral American IndianCherokeeCheyenneChickasawChileanChineseChippewaChoctawColombianColvilleComancheCosta RicanCreeCreekCroatianCrowCubanCypriotCzechCzechoslovakianDanishDelawareDominicanDutchDutch West IndianEastern EuropeanEcuadorianEgyptianEnglishEstonianEthiopianEuropeanFijianFilipinoFinnishFrenchFrench American IndianFrench CanadianGermanGerman RussianGhanaianGreekGuamanian/ChamorroGuatemalanGuyaneseHaitianHmongHonduranHopiHoumaHungarianIcelanderIndian (Asian)IndonesianInupiatIranianIraqiIrishIroquoisIsraeliItalianJamaicanJapaneseJordanianKenyanKiowaKoreanLaotianLatvianLebaneseLiberianLithuanianLumbeeLuxembourgerMacedonianMalaysianMalteseMarshalleseMenomineeMexicanMexican American IndianMongolianMoroccanNative HawaiianNavajoNepaleseNew ZealanderNicaraguanNigerianNorthern EuropeanNorwegianOkinawanOsageOttawaPaiutePakistaniPalestinianPanamanianParaguayanPennsylvania GermanPeruvianPimaPolishPortuguesePotawatomiPuebloPuerto RicanPuget Sound SalishRomanianRussianSalvadoranSamoanScandinavianScotch-IrishScottishSeminoleSenegaleseShoshoneSierra LeoneanSiouxSlavicSlovakSloveneSomaliSouth AfricanSouth AmericanSouth American IndianSoviet UnionSpaniardSpanishSpanish AmericanSpanish American IndianSri LankanSubsaharan AfricanSudaneseSwedishSwissSyrianTaiwaneseThaiTlingit-HaidaTohono O'OdhamTonganTrinidadian and TobagonianTsimshianTurkishU.S. Virgin IslanderUgandanUkrainianUruguayanUteVenezuelanVietnameseWelshWest IndianYakamaYaquiYugoslavianYumanYup'ikZimbabwean
Immigration
NonimmigrantsImmigrantsAfghanistanAfricaAlbaniaArgentinaArmeniaAsiaAustraliaAustriaBahamasBangladeshBarbadosBelarusBelgiumBelizeBoliviaBosnia and HerzegovinaBrazilBulgariaBurma/MyanmarCabo VerdeCambodiaCameroonCanadaCaribbeanCentral AmericaChileChinaColombiaCongoCosta RicaCroatiaCubaCzechoslovakiaDenmarkDominicaDominican RepublicEastern AfricaEastern AsiaEastern EuropeEcuadorEgyptEl SalvadorEnglandEritreaEthiopiaEuropeFijiFranceGermanyGhanaGreeceGrenadaGuatemalaGuyanaHaitiHondurasHong KongHungaryIndiaIndonesiaIranIraqIrelandIsraelItalyJamaicaJapanJordanKazakhstanKenyaKoreaKuwaitLaosLatin AmericaLatviaLebanonLiberiaLithuaniaMalaysiaMexicoMicronesiaMiddle AfricaMoldovaMoroccoNepalNetherlandsNicaraguaNigeriaNorth AmericaNorth MacedoniaNorthern AfricaNorthern EuropeNorwayOceaniaPakistanPanamaPeruPhilippinesPolandPortugalRomaniaRussiaSaudi ArabiaScotlandSenegalSerbiaSierra LeoneSingaporeSomaliaSouth AfricaSouth AmericaSouth Central AsiaSouth Eastern AsiaSouthern EuropeSpainSri LankaSt. Vincent and the GrenadinesSudanSwedenSwitzerlandSyriaTaiwanThailandTrinidad and TobagoTurkeyUgandaUkraineUruguayUzbekistanVenezuelaVietnamWest IndiesWestern AfricaWestern AsiaWestern EuropeYemenZaireZimbabweAzores
Serbian
Race
Ancestry
AfghanAfricanAlaska NativeAlaskan AthabascanAlbanianAleutAlsatianAmericanApacheArabArapahoArgentineanArmenianAssyrian/Chaldean/SyriacAustralianAustrianBahamianBangladeshiBarbadianBasqueBelgianBelizeanBermudanBhutaneseBlackfeetBolivianBrazilianBritishBritish West IndianBulgarianBurmeseCajunCambodianCanadianCape VerdeanCarpatho RusynCelticCentral AmericanCentral American IndianCherokeeCheyenneChickasawChileanChineseChippewaChoctawColombianColvilleComancheCosta RicanCreeCreekCroatianCrowCubanCypriotCzechCzechoslovakianDanishDelawareDominicanDutchDutch West IndianEastern EuropeanEcuadorianEgyptianEnglishEstonianEthiopianEuropeanFijianFilipinoFinnishFrenchFrench American IndianFrench CanadianGermanGerman RussianGhanaianGreekGuamanian/ChamorroGuatemalanGuyaneseHaitianHmongHonduranHopiHoumaHungarianIcelanderIndian (Asian)IndonesianInupiatIranianIraqiIrishIroquoisIsraeliItalianJamaicanJapaneseJordanianKenyanKiowaKoreanLaotianLatvianLebaneseLiberianLithuanianLumbeeLuxembourgerMacedonianMalaysianMalteseMarshalleseMenomineeMexicanMexican American IndianMongolianMoroccanNative HawaiianNavajoNepaleseNew ZealanderNicaraguanNigerianNorthern EuropeanNorwegianOkinawanOsageOttawaPaiutePakistaniPalestinianPanamanianParaguayanPennsylvania GermanPeruvianPimaPolishPortuguesePotawatomiPuebloPuerto RicanPuget Sound SalishRomanianRussianSalvadoranSamoanScandinavianScotch-IrishScottishSeminoleSenegaleseSerbianShoshoneSierra LeoneanSiouxSlavicSlovakSloveneSomaliSouth AfricanSouth AmericanSouth American IndianSoviet UnionSpaniardSpanishSpanish AmericanSpanish American IndianSri LankanSubsaharan AfricanSudaneseSwedishSwissSyrianTaiwaneseThaiTlingit-HaidaTohono O'OdhamTonganTrinidadian and TobagonianTsimshianTurkishU.S. Virgin IslanderUgandanUkrainianUruguayanUteVenezuelanVietnameseWelshWest IndianYakamaYaquiYugoslavianYumanYup'ikZimbabwean
Immigration
NonimmigrantsImmigrantsAfghanistanAfricaAlbaniaArgentinaArmeniaAsiaAustraliaAustriaBahamasBangladeshBarbadosBelarusBelgiumBelizeBoliviaBosnia and HerzegovinaBrazilBulgariaBurma/MyanmarCabo VerdeCambodiaCameroonCanadaCaribbeanCentral AmericaChileChinaColombiaCongoCosta RicaCroatiaCubaCzechoslovakiaDenmarkDominicaDominican RepublicEastern AfricaEastern AsiaEastern EuropeEcuadorEgyptEl SalvadorEnglandEritreaEthiopiaEuropeFijiGermanyGhanaGreeceGrenadaGuatemalaGuyanaHaitiHondurasHong KongHungaryIndiaIndonesiaIranIraqIrelandIsraelItalyJamaicaJapanJordanKazakhstanKenyaKoreaKuwaitLaosLatin AmericaLatviaLebanonLiberiaLithuaniaMalaysiaMexicoMicronesiaMiddle AfricaMoldovaMoroccoNepalNetherlandsNicaraguaNigeriaNorth AmericaNorth MacedoniaNorthern AfricaNorthern EuropeNorwayOceaniaPakistanPanamaPeruPhilippinesPolandPortugalRomaniaRussiaSaudi ArabiaScotlandSenegalSerbiaSierra LeoneSingaporeSomaliaSouth AfricaSouth AmericaSouth Central AsiaSouth Eastern AsiaSouthern EuropeSpainSri LankaSt. Vincent and the GrenadinesSudanSwedenSwitzerlandSyriaTaiwanThailandTrinidad and TobagoTurkeyUgandaUkraineUruguayUzbekistanVenezuelaVietnamWest IndiesWestern AfricaWestern AsiaWestern EuropeYemenZaireZimbabweAzores
Married-couple Households
Income
Poverty
Unemployment
Labor Participation
Family Structure
Vehicle Availability
Education Level
Disability

Married-couple Households Comparison

Immigrants from France

Serbians

Tragic
Good
45.4%
MARRIED-COUPLE HOUSEHOLDS
8.8/ 100
METRIC RATING
207th/ 347
METRIC RANK
47.0%
MARRIED-COUPLE HOUSEHOLDS
76.3/ 100
METRIC RATING
152nd/ 347
METRIC RANK

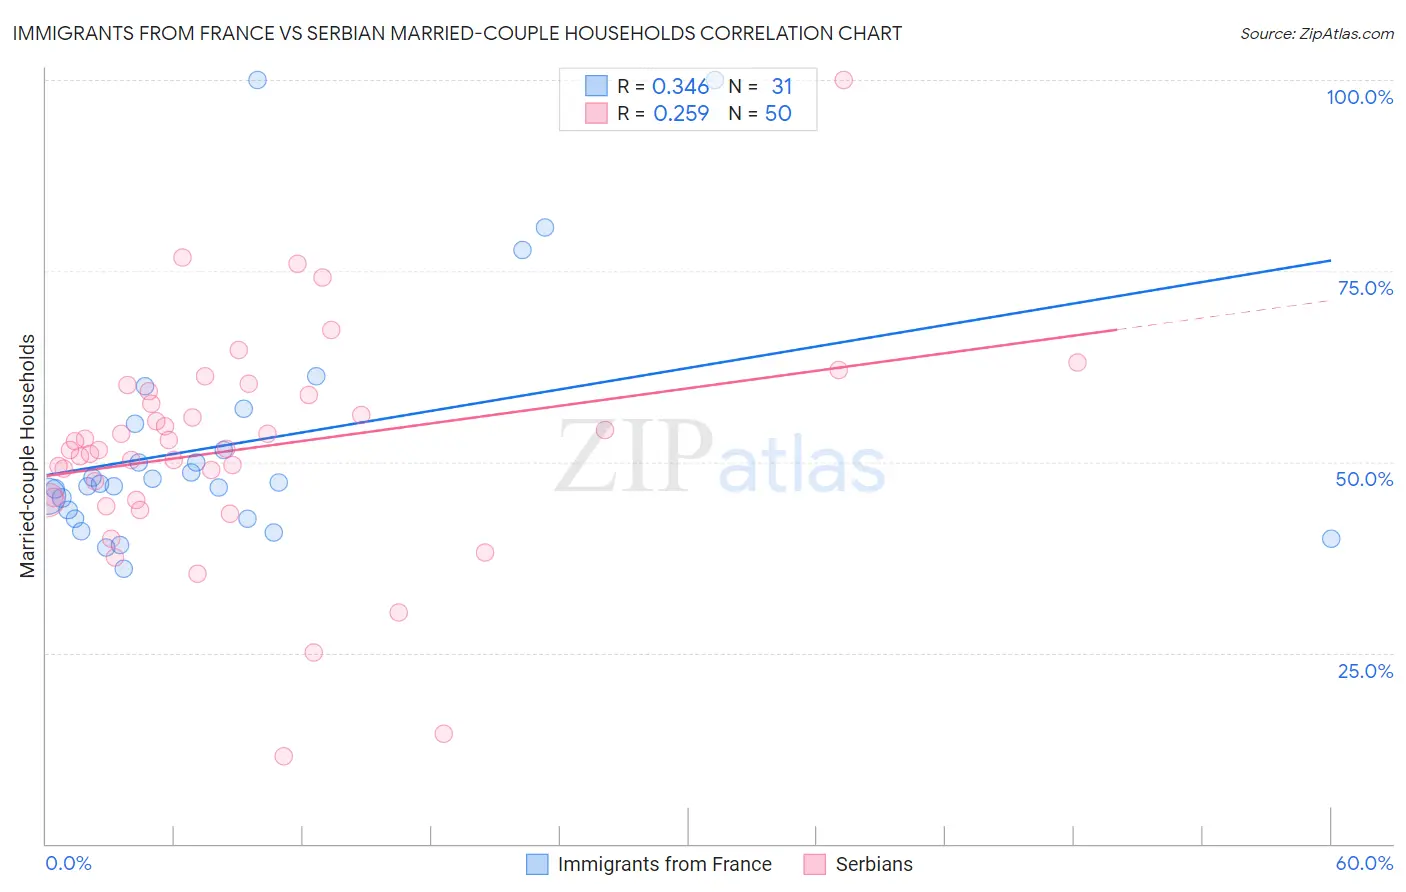
Immigrants from France vs Serbian Married-couple Households Correlation Chart

The statistical analysis conducted on geographies consisting of 287,855,925 people shows a mild positive correlation between the proportion of Immigrants from France and percentage of married-couple family households in the United States with a correlation coefficient (R) of 0.346 and weighted average of 45.4%. Similarly, the statistical analysis conducted on geographies consisting of 267,530,139 people shows a weak positive correlation between the proportion of Serbians and percentage of married-couple family households in the United States with a correlation coefficient (R) of 0.259 and weighted average of 47.0%, a difference of 3.4%.
Immigrants from France vs Serbian Married-couple Households

Married-couple Households Correlation Summary

MeasurementImmigrants from FranceSerbian
Minimum36.1%11.4%
Maximum100.0%100.0%
Range63.9%88.6%
Mean52.4%51.7%
Median47.2%51.7%
Interquartile 25% (IQ1)42.6%45.0%
Interquartile 75% (IQ3)54.9%58.7%
Interquartile Range (IQR)12.3%13.7%
Standard Deviation (Sample)16.1%14.6%
Standard Deviation (Population)15.9%14.5%

Similar Demographics by Married-couple Households

Demographics Similar to Immigrants from France by Married-couple Households

In terms of married-couple households, the demographic groups most similar to Immigrants from France are Hispanic or Latino (45.4%, a difference of 0.010%), Immigrants from Uzbekistan (45.4%, a difference of 0.050%), Cuban (45.4%, a difference of 0.14%), Uruguayan (45.5%, a difference of 0.18%), and Immigrants from Spain (45.3%, a difference of 0.19%).
DemographicsRating | RankMarried-couple Households
Potawatomi
15.6
/100
|
#200
Poor
45.7%
Immigrants | Serbia
15.2
/100
|
#201
Poor
45.7%
Immigrants | Central America
14.2
/100
|
#202
Poor
45.7%
Alaska Natives
13.0
/100
|
#203
Poor
45.6%
Aleuts
12.5
/100
|
#204
Poor
45.6%
Nepalese
11.9
/100
|
#205
Poor
45.6%
Uruguayans
10.4
/100
|
#206
Poor
45.5%
Immigrants | France
8.8
/100
|
#207
Tragic
45.4%
Hispanics or Latinos
8.7
/100
|
#208
Tragic
45.4%
Immigrants | Uzbekistan
8.4
/100
|
#209
Tragic
45.4%
Cubans
7.7
/100
|
#210
Tragic
45.4%
Immigrants | Spain
7.3
/100
|
#211
Tragic
45.3%
Creek
6.4
/100
|
#212
Tragic
45.3%
Yakama
5.8
/100
|
#213
Tragic
45.2%
Japanese
5.7
/100
|
#214
Tragic
45.2%

Demographics Similar to Serbians by Married-couple Households

In terms of married-couple households, the demographic groups most similar to Serbians are Hmong (47.0%, a difference of 0.010%), Immigrants from Western Asia (46.9%, a difference of 0.010%), Immigrants from Bulgaria (47.0%, a difference of 0.020%), Arab (46.9%, a difference of 0.020%), and Armenian (46.9%, a difference of 0.050%).
DemographicsRating | RankMarried-couple Households
Slovenes
81.7
/100
|
#145
Excellent
47.1%
Immigrants | Western Europe
81.6
/100
|
#146
Excellent
47.1%
Immigrants | Syria
81.6
/100
|
#147
Excellent
47.1%
Icelanders
79.5
/100
|
#148
Good
47.0%
Paraguayans
78.7
/100
|
#149
Good
47.0%
Immigrants | Russia
77.6
/100
|
#150
Good
47.0%
Immigrants | Bulgaria
76.8
/100
|
#151
Good
47.0%
Serbians
76.3
/100
|
#152
Good
47.0%
Hmong
76.2
/100
|
#153
Good
47.0%
Immigrants | Western Asia
76.1
/100
|
#154
Good
46.9%
Arabs
76.0
/100
|
#155
Good
46.9%
Armenians
75.4
/100
|
#156
Good
46.9%
Immigrants | Oceania
74.8
/100
|
#157
Good
46.9%
Immigrants | Nonimmigrants
73.3
/100
|
#158
Good
46.9%
Osage
73.2
/100
|
#159
Good
46.9%