Immigrants from Fiji vs Immigrants from Nepal Married-couple Households
COMPARE
Immigrants from Fiji
Immigrants from Nepal
Married-couple Households
Married-couple Households Comparison
Immigrants from Fiji
Immigrants from Nepal
48.2%
MARRIED-COUPLE HOUSEHOLDS
98.4/ 100
METRIC RATING
76th/ 347
METRIC RANK
45.2%
MARRIED-COUPLE HOUSEHOLDS
5.6/ 100
METRIC RATING
215th/ 347
METRIC RANK
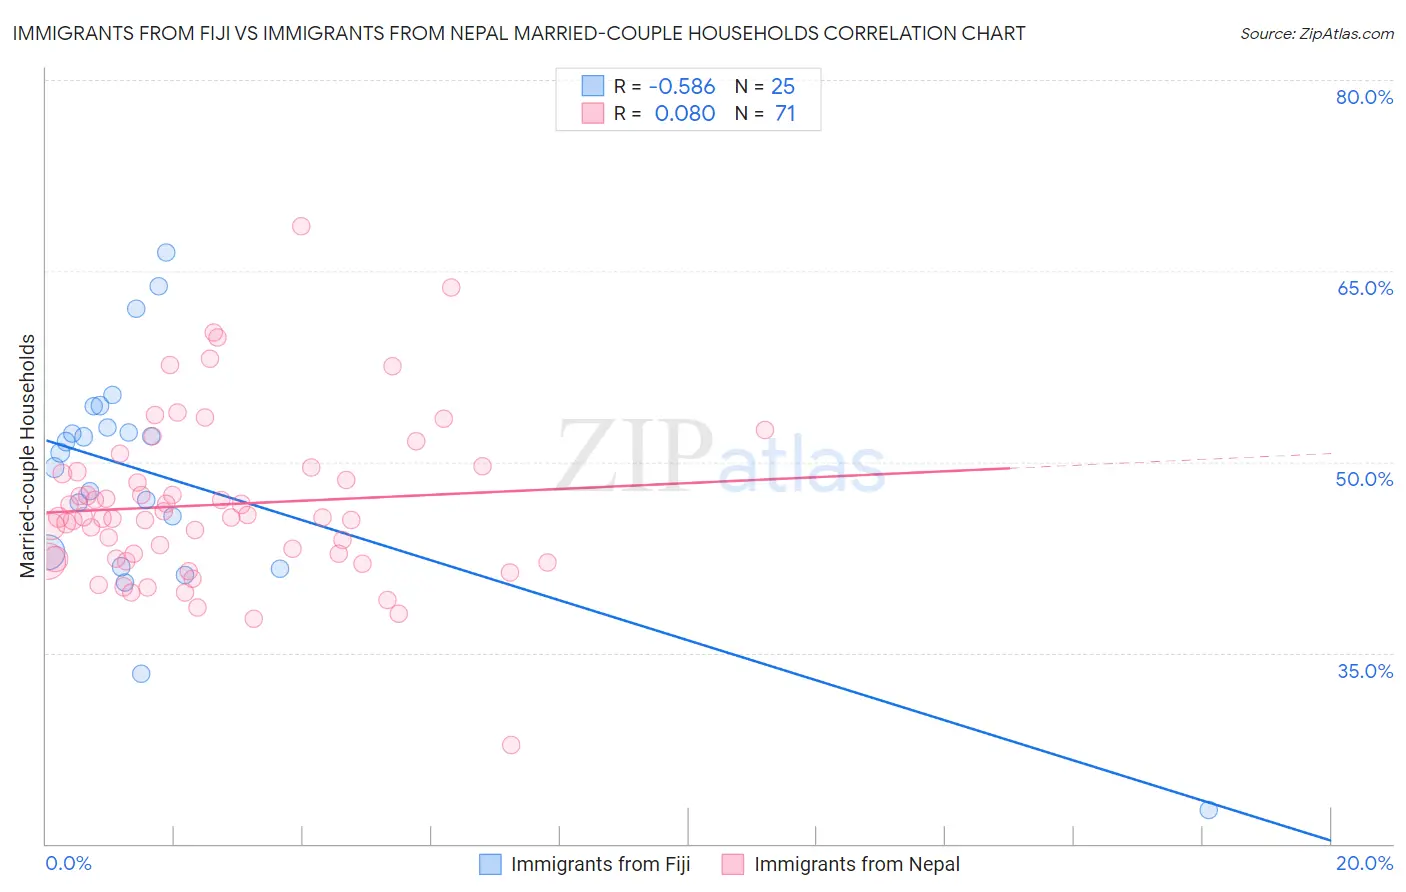
Immigrants from Fiji vs Immigrants from Nepal Married-couple Households Correlation Chart
The statistical analysis conducted on geographies consisting of 93,754,900 people shows a substantial negative correlation between the proportion of Immigrants from Fiji and percentage of married-couple family households in the United States with a correlation coefficient (R) of -0.586 and weighted average of 48.2%. Similarly, the statistical analysis conducted on geographies consisting of 186,686,062 people shows a slight positive correlation between the proportion of Immigrants from Nepal and percentage of married-couple family households in the United States with a correlation coefficient (R) of 0.080 and weighted average of 45.2%, a difference of 6.7%.
Married-couple Households Correlation Summary
| Measurement | Immigrants from Fiji | Immigrants from Nepal |
| Minimum | 22.7% | 27.8% |
| Maximum | 66.5% | 68.6% |
| Range | 43.8% | 40.8% |
| Mean | 48.8% | 46.6% |
| Median | 50.7% | 45.6% |
| Interquartile 25% (IQ1) | 42.3% | 42.3% |
| Interquartile 75% (IQ3) | 53.6% | 49.2% |
| Interquartile Range (IQR) | 11.2% | 6.9% |
| Standard Deviation (Sample) | 9.3% | 6.5% |
| Standard Deviation (Population) | 9.1% | 6.5% |
Similar Demographics by Married-couple Households
Demographics Similar to Immigrants from Fiji by Married-couple Households
In terms of married-couple households, the demographic groups most similar to Immigrants from Fiji are Immigrants from England (48.2%, a difference of 0.0%), Immigrants from Romania (48.3%, a difference of 0.090%), Immigrants from Singapore (48.3%, a difference of 0.10%), Canadian (48.2%, a difference of 0.10%), and Egyptian (48.2%, a difference of 0.12%).
| Demographics | Rating | Rank | Married-couple Households |
| Immigrants | China | 98.9 /100 | #69 | Exceptional 48.4% |
| Immigrants | North America | 98.9 /100 | #70 | Exceptional 48.4% |
| Laotians | 98.8 /100 | #71 | Exceptional 48.4% |
| Scotch-Irish | 98.6 /100 | #72 | Exceptional 48.3% |
| Immigrants | Singapore | 98.6 /100 | #73 | Exceptional 48.3% |
| Immigrants | Romania | 98.6 /100 | #74 | Exceptional 48.3% |
| Immigrants | England | 98.4 /100 | #75 | Exceptional 48.2% |
| Immigrants | Fiji | 98.4 /100 | #76 | Exceptional 48.2% |
| Canadians | 98.2 /100 | #77 | Exceptional 48.2% |
| Egyptians | 98.2 /100 | #78 | Exceptional 48.2% |
| Immigrants | Netherlands | 98.2 /100 | #79 | Exceptional 48.2% |
| Russians | 98.1 /100 | #80 | Exceptional 48.2% |
| Finns | 98.0 /100 | #81 | Exceptional 48.1% |
| Immigrants | Poland | 97.7 /100 | #82 | Exceptional 48.1% |
| Guamanians/Chamorros | 97.6 /100 | #83 | Exceptional 48.1% |
Demographics Similar to Immigrants from Nepal by Married-couple Households
In terms of married-couple households, the demographic groups most similar to Immigrants from Nepal are Immigrants from Portugal (45.2%, a difference of 0.0%), Japanese (45.2%, a difference of 0.020%), Panamanian (45.2%, a difference of 0.020%), Yakama (45.2%, a difference of 0.040%), and Immigrants from the Azores (45.2%, a difference of 0.050%).
| Demographics | Rating | Rank | Married-couple Households |
| Hispanics or Latinos | 8.7 /100 | #208 | Tragic 45.4% |
| Immigrants | Uzbekistan | 8.4 /100 | #209 | Tragic 45.4% |
| Cubans | 7.7 /100 | #210 | Tragic 45.4% |
| Immigrants | Spain | 7.3 /100 | #211 | Tragic 45.3% |
| Creek | 6.4 /100 | #212 | Tragic 45.3% |
| Yakama | 5.8 /100 | #213 | Tragic 45.2% |
| Japanese | 5.7 /100 | #214 | Tragic 45.2% |
| Immigrants | Nepal | 5.6 /100 | #215 | Tragic 45.2% |
| Immigrants | Portugal | 5.6 /100 | #216 | Tragic 45.2% |
| Panamanians | 5.5 /100 | #217 | Tragic 45.2% |
| Immigrants | Azores | 5.3 /100 | #218 | Tragic 45.2% |
| Nicaraguans | 5.3 /100 | #219 | Tragic 45.2% |
| Immigrants | Thailand | 5.1 /100 | #220 | Tragic 45.2% |
| Tlingit-Haida | 4.9 /100 | #221 | Tragic 45.1% |
| Immigrants | Laos | 4.6 /100 | #222 | Tragic 45.1% |