Immigrants from Fiji vs Australian Married-couple Households
COMPARE
Immigrants from Fiji
Australian
Married-couple Households
Married-couple Households Comparison
Immigrants from Fiji
Australians
48.2%
MARRIED-COUPLE HOUSEHOLDS
98.4/ 100
METRIC RATING
76th/ 347
METRIC RANK
47.4%
MARRIED-COUPLE HOUSEHOLDS
89.0/ 100
METRIC RATING
125th/ 347
METRIC RANK
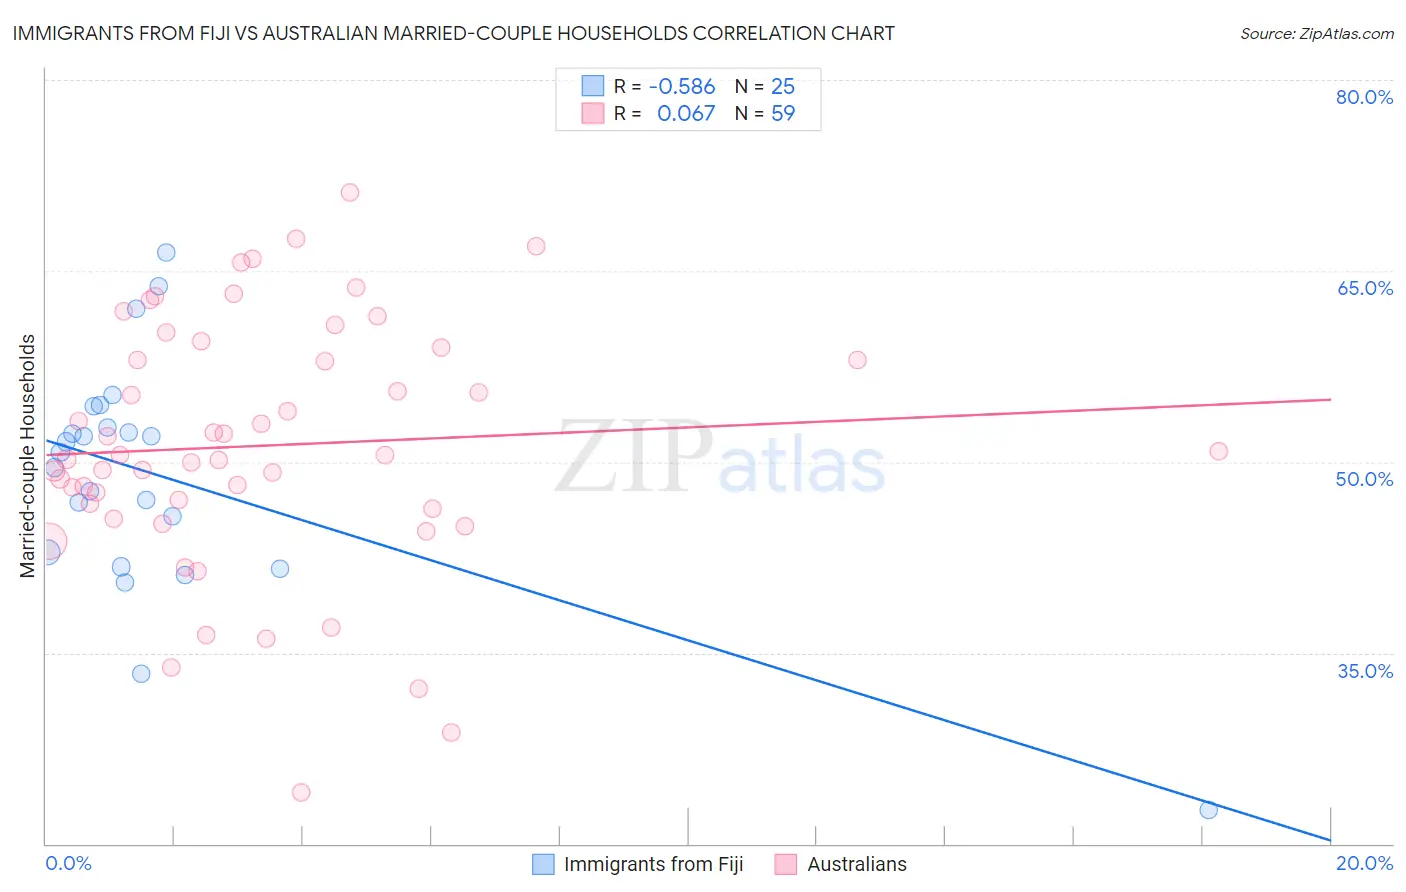
Immigrants from Fiji vs Australian Married-couple Households Correlation Chart
The statistical analysis conducted on geographies consisting of 93,754,900 people shows a substantial negative correlation between the proportion of Immigrants from Fiji and percentage of married-couple family households in the United States with a correlation coefficient (R) of -0.586 and weighted average of 48.2%. Similarly, the statistical analysis conducted on geographies consisting of 224,029,086 people shows a slight positive correlation between the proportion of Australians and percentage of married-couple family households in the United States with a correlation coefficient (R) of 0.067 and weighted average of 47.4%, a difference of 1.9%.
Married-couple Households Correlation Summary
| Measurement | Immigrants from Fiji | Australian |
| Minimum | 22.7% | 24.0% |
| Maximum | 66.5% | 71.2% |
| Range | 43.8% | 47.2% |
| Mean | 48.8% | 51.3% |
| Median | 50.7% | 50.6% |
| Interquartile 25% (IQ1) | 42.3% | 46.3% |
| Interquartile 75% (IQ3) | 53.6% | 59.0% |
| Interquartile Range (IQR) | 11.2% | 12.7% |
| Standard Deviation (Sample) | 9.3% | 9.9% |
| Standard Deviation (Population) | 9.1% | 9.9% |
Similar Demographics by Married-couple Households
Demographics Similar to Immigrants from Fiji by Married-couple Households
In terms of married-couple households, the demographic groups most similar to Immigrants from Fiji are Immigrants from England (48.2%, a difference of 0.0%), Immigrants from Romania (48.3%, a difference of 0.090%), Immigrants from Singapore (48.3%, a difference of 0.10%), Canadian (48.2%, a difference of 0.10%), and Egyptian (48.2%, a difference of 0.12%).
| Demographics | Rating | Rank | Married-couple Households |
| Immigrants | China | 98.9 /100 | #69 | Exceptional 48.4% |
| Immigrants | North America | 98.9 /100 | #70 | Exceptional 48.4% |
| Laotians | 98.8 /100 | #71 | Exceptional 48.4% |
| Scotch-Irish | 98.6 /100 | #72 | Exceptional 48.3% |
| Immigrants | Singapore | 98.6 /100 | #73 | Exceptional 48.3% |
| Immigrants | Romania | 98.6 /100 | #74 | Exceptional 48.3% |
| Immigrants | England | 98.4 /100 | #75 | Exceptional 48.2% |
| Immigrants | Fiji | 98.4 /100 | #76 | Exceptional 48.2% |
| Canadians | 98.2 /100 | #77 | Exceptional 48.2% |
| Egyptians | 98.2 /100 | #78 | Exceptional 48.2% |
| Immigrants | Netherlands | 98.2 /100 | #79 | Exceptional 48.2% |
| Russians | 98.1 /100 | #80 | Exceptional 48.2% |
| Finns | 98.0 /100 | #81 | Exceptional 48.1% |
| Immigrants | Poland | 97.7 /100 | #82 | Exceptional 48.1% |
| Guamanians/Chamorros | 97.6 /100 | #83 | Exceptional 48.1% |
Demographics Similar to Australians by Married-couple Households
In terms of married-couple households, the demographic groups most similar to Australians are Zimbabwean (47.4%, a difference of 0.020%), Immigrants from Venezuela (47.4%, a difference of 0.030%), Pakistani (47.3%, a difference of 0.030%), Celtic (47.3%, a difference of 0.080%), and Immigrants from Peru (47.3%, a difference of 0.10%).
| Demographics | Rating | Rank | Married-couple Households |
| Immigrants | Germany | 92.4 /100 | #118 | Exceptional 47.5% |
| Chileans | 92.2 /100 | #119 | Exceptional 47.5% |
| Puget Sound Salish | 90.5 /100 | #120 | Exceptional 47.4% |
| Immigrants | Eastern Europe | 90.3 /100 | #121 | Exceptional 47.4% |
| Okinawans | 90.1 /100 | #122 | Exceptional 47.4% |
| Immigrants | Venezuela | 89.3 /100 | #123 | Excellent 47.4% |
| Zimbabweans | 89.2 /100 | #124 | Excellent 47.4% |
| Australians | 89.0 /100 | #125 | Excellent 47.4% |
| Pakistanis | 88.6 /100 | #126 | Excellent 47.3% |
| Celtics | 88.1 /100 | #127 | Excellent 47.3% |
| Immigrants | Peru | 87.9 /100 | #128 | Excellent 47.3% |
| Immigrants | Iraq | 87.8 /100 | #129 | Excellent 47.3% |
| Immigrants | Hungary | 87.8 /100 | #130 | Excellent 47.3% |
| Immigrants | Denmark | 87.5 /100 | #131 | Excellent 47.3% |
| Immigrants | Ukraine | 86.7 /100 | #132 | Excellent 47.3% |