Immigrants from Fiji vs Guamanian/Chamorro Married-couple Households
COMPARE
Immigrants from Fiji
Guamanian/Chamorro
Married-couple Households
Married-couple Households Comparison
Immigrants from Fiji
Guamanians/Chamorros
48.2%
MARRIED-COUPLE HOUSEHOLDS
98.4/ 100
METRIC RATING
76th/ 347
METRIC RANK
48.1%
MARRIED-COUPLE HOUSEHOLDS
97.6/ 100
METRIC RATING
83rd/ 347
METRIC RANK
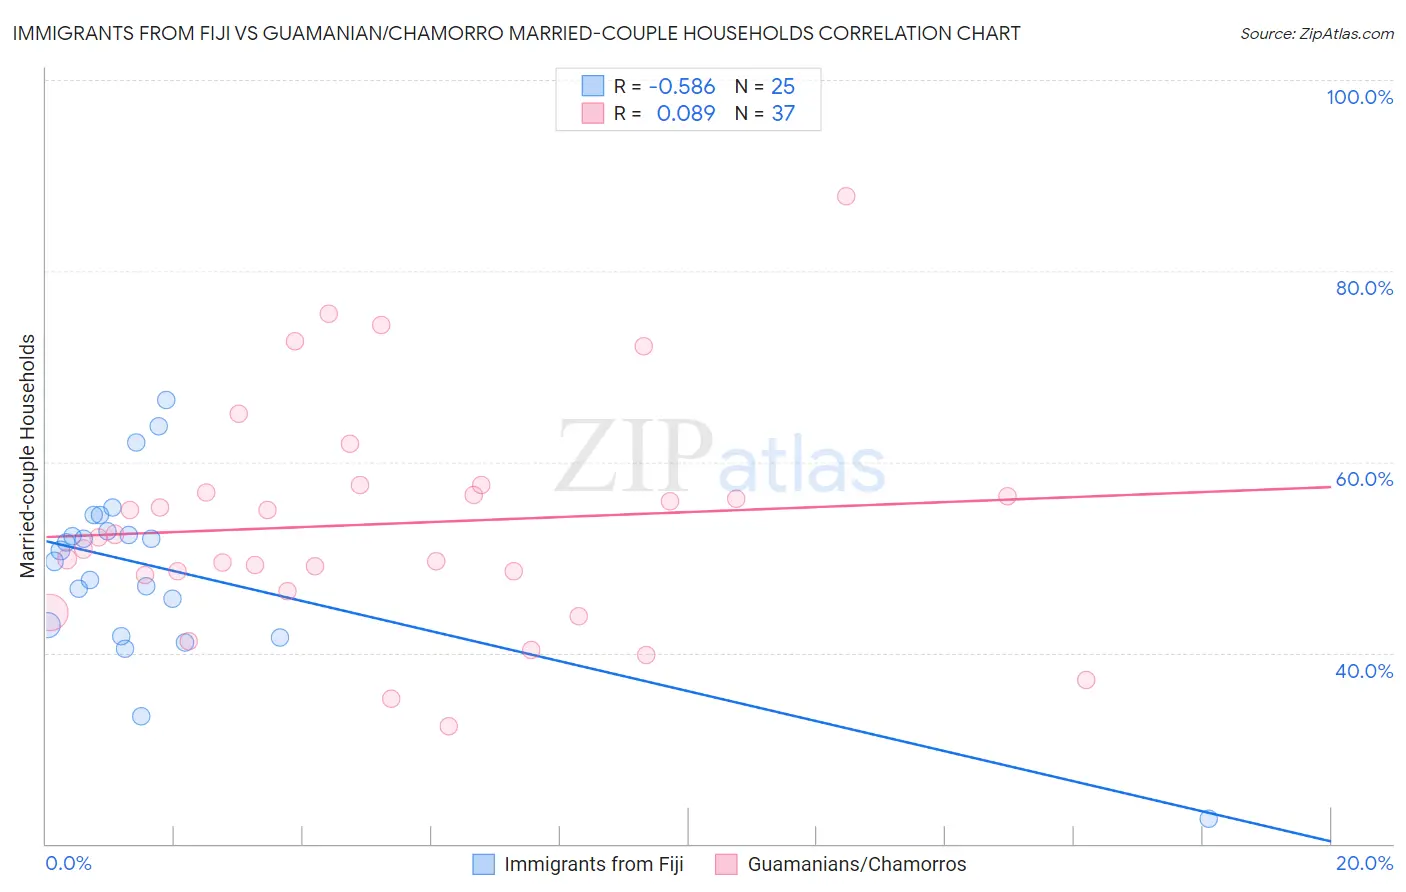
Immigrants from Fiji vs Guamanian/Chamorro Married-couple Households Correlation Chart
The statistical analysis conducted on geographies consisting of 93,754,900 people shows a substantial negative correlation between the proportion of Immigrants from Fiji and percentage of married-couple family households in the United States with a correlation coefficient (R) of -0.586 and weighted average of 48.2%. Similarly, the statistical analysis conducted on geographies consisting of 221,863,144 people shows a slight positive correlation between the proportion of Guamanians/Chamorros and percentage of married-couple family households in the United States with a correlation coefficient (R) of 0.089 and weighted average of 48.1%, a difference of 0.37%.
Married-couple Households Correlation Summary
| Measurement | Immigrants from Fiji | Guamanian/Chamorro |
| Minimum | 22.7% | 32.3% |
| Maximum | 66.5% | 87.9% |
| Range | 43.8% | 55.5% |
| Mean | 48.8% | 53.5% |
| Median | 50.7% | 52.1% |
| Interquartile 25% (IQ1) | 42.3% | 47.3% |
| Interquartile 75% (IQ3) | 53.6% | 57.2% |
| Interquartile Range (IQR) | 11.2% | 9.9% |
| Standard Deviation (Sample) | 9.3% | 11.9% |
| Standard Deviation (Population) | 9.1% | 11.7% |
Demographics Similar to Immigrants from Fiji and Guamanians/Chamorros by Married-couple Households
In terms of married-couple households, the demographic groups most similar to Immigrants from Fiji are Immigrants from England (48.2%, a difference of 0.0%), Immigrants from Romania (48.3%, a difference of 0.090%), Immigrants from Singapore (48.3%, a difference of 0.10%), Canadian (48.2%, a difference of 0.10%), and Egyptian (48.2%, a difference of 0.12%). Similarly, the demographic groups most similar to Guamanians/Chamorros are Immigrants from Poland (48.1%, a difference of 0.020%), Ukrainian (48.1%, a difference of 0.020%), Immigrants from Israel (48.0%, a difference of 0.070%), Belgian (48.0%, a difference of 0.090%), and Immigrants from Ireland (48.0%, a difference of 0.11%).
| Demographics | Rating | Rank | Married-couple Households |
| Immigrants | China | 98.9 /100 | #69 | Exceptional 48.4% |
| Immigrants | North America | 98.9 /100 | #70 | Exceptional 48.4% |
| Laotians | 98.8 /100 | #71 | Exceptional 48.4% |
| Scotch-Irish | 98.6 /100 | #72 | Exceptional 48.3% |
| Immigrants | Singapore | 98.6 /100 | #73 | Exceptional 48.3% |
| Immigrants | Romania | 98.6 /100 | #74 | Exceptional 48.3% |
| Immigrants | England | 98.4 /100 | #75 | Exceptional 48.2% |
| Immigrants | Fiji | 98.4 /100 | #76 | Exceptional 48.2% |
| Canadians | 98.2 /100 | #77 | Exceptional 48.2% |
| Egyptians | 98.2 /100 | #78 | Exceptional 48.2% |
| Immigrants | Netherlands | 98.2 /100 | #79 | Exceptional 48.2% |
| Russians | 98.1 /100 | #80 | Exceptional 48.2% |
| Finns | 98.0 /100 | #81 | Exceptional 48.1% |
| Immigrants | Poland | 97.7 /100 | #82 | Exceptional 48.1% |
| Guamanians/Chamorros | 97.6 /100 | #83 | Exceptional 48.1% |
| Ukrainians | 97.6 /100 | #84 | Exceptional 48.1% |
| Immigrants | Israel | 97.4 /100 | #85 | Exceptional 48.0% |
| Belgians | 97.4 /100 | #86 | Exceptional 48.0% |
| Immigrants | Ireland | 97.3 /100 | #87 | Exceptional 48.0% |
| Afghans | 97.3 /100 | #88 | Exceptional 48.0% |
| Cypriots | 97.2 /100 | #89 | Exceptional 48.0% |