Immigrants from Burma/Myanmar vs Cherokee Family Households with Children
COMPARE
Immigrants from Burma/Myanmar
Cherokee
Family Households with Children
Family Households with Children Comparison
Immigrants from Burma/Myanmar
Cherokee
28.0%
FAMILY HOUSEHOLDS WITH CHILDREN
97.7/ 100
METRIC RATING
108th/ 347
METRIC RANK
27.5%
FAMILY HOUSEHOLDS WITH CHILDREN
56.7/ 100
METRIC RATING
170th/ 347
METRIC RANK
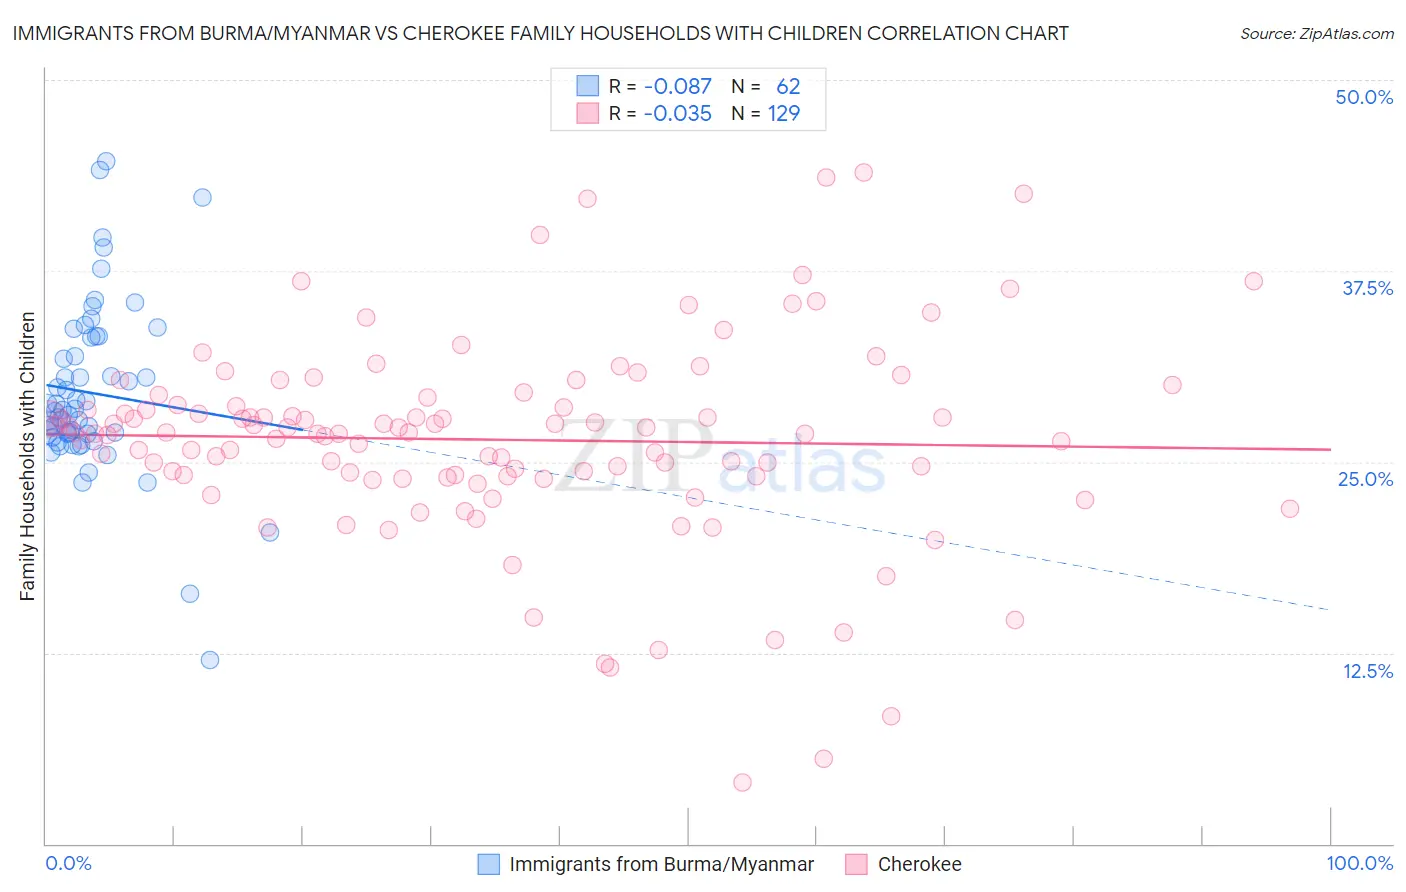
Immigrants from Burma/Myanmar vs Cherokee Family Households with Children Correlation Chart
The statistical analysis conducted on geographies consisting of 172,235,396 people shows a slight negative correlation between the proportion of Immigrants from Burma/Myanmar and percentage of family households with children in the United States with a correlation coefficient (R) of -0.087 and weighted average of 28.0%. Similarly, the statistical analysis conducted on geographies consisting of 493,173,855 people shows no correlation between the proportion of Cherokee and percentage of family households with children in the United States with a correlation coefficient (R) of -0.035 and weighted average of 27.5%, a difference of 1.9%.
Family Households with Children Correlation Summary
| Measurement | Immigrants from Burma/Myanmar | Cherokee |
| Minimum | 12.1% | 4.0% |
| Maximum | 44.7% | 43.9% |
| Range | 32.6% | 39.9% |
| Mean | 29.5% | 26.5% |
| Median | 28.3% | 26.9% |
| Interquartile 25% (IQ1) | 26.9% | 24.1% |
| Interquartile 75% (IQ3) | 33.1% | 29.0% |
| Interquartile Range (IQR) | 6.2% | 4.9% |
| Standard Deviation (Sample) | 5.7% | 6.6% |
| Standard Deviation (Population) | 5.6% | 6.6% |
Similar Demographics by Family Households with Children
Demographics Similar to Immigrants from Burma/Myanmar by Family Households with Children
In terms of family households with children, the demographic groups most similar to Immigrants from Burma/Myanmar are Immigrants from Uganda (28.0%, a difference of 0.010%), Tohono O'odham (28.0%, a difference of 0.010%), Spaniard (28.0%, a difference of 0.050%), Immigrants from South America (28.0%, a difference of 0.080%), and Scandinavian (28.0%, a difference of 0.11%).
| Demographics | Rating | Rank | Family Households with Children |
| Immigrants | Oceania | 98.8 /100 | #101 | Exceptional 28.1% |
| Assyrians/Chaldeans/Syriacs | 98.7 /100 | #102 | Exceptional 28.1% |
| Palestinians | 98.5 /100 | #103 | Exceptional 28.1% |
| Sioux | 98.3 /100 | #104 | Exceptional 28.1% |
| Choctaw | 98.3 /100 | #105 | Exceptional 28.1% |
| Immigrants | South America | 98.0 /100 | #106 | Exceptional 28.0% |
| Immigrants | Uganda | 97.7 /100 | #107 | Exceptional 28.0% |
| Immigrants | Burma/Myanmar | 97.7 /100 | #108 | Exceptional 28.0% |
| Tohono O'odham | 97.6 /100 | #109 | Exceptional 28.0% |
| Spaniards | 97.4 /100 | #110 | Exceptional 28.0% |
| Scandinavians | 97.1 /100 | #111 | Exceptional 28.0% |
| Immigrants | Middle Africa | 97.0 /100 | #112 | Exceptional 28.0% |
| Arabs | 97.0 /100 | #113 | Exceptional 28.0% |
| South American Indians | 96.9 /100 | #114 | Exceptional 28.0% |
| Immigrants | Africa | 96.8 /100 | #115 | Exceptional 28.0% |
Demographics Similar to Cherokee by Family Households with Children
In terms of family households with children, the demographic groups most similar to Cherokee are Seminole (27.5%, a difference of 0.0%), Blackfeet (27.5%, a difference of 0.050%), Israeli (27.5%, a difference of 0.060%), Immigrants from Kuwait (27.5%, a difference of 0.090%), and Immigrants from South Africa (27.5%, a difference of 0.10%).
| Demographics | Rating | Rank | Family Households with Children |
| Czechs | 65.3 /100 | #163 | Good 27.5% |
| Immigrants | Hong Kong | 64.9 /100 | #164 | Good 27.5% |
| Immigrants | South Africa | 61.3 /100 | #165 | Good 27.5% |
| Immigrants | Nonimmigrants | 61.2 /100 | #166 | Good 27.5% |
| Dominicans | 61.1 /100 | #167 | Good 27.5% |
| Immigrants | Kuwait | 60.9 /100 | #168 | Good 27.5% |
| Seminole | 56.9 /100 | #169 | Average 27.5% |
| Cherokee | 56.7 /100 | #170 | Average 27.5% |
| Blackfeet | 54.3 /100 | #171 | Average 27.5% |
| Israelis | 53.9 /100 | #172 | Average 27.5% |
| Immigrants | Argentina | 52.2 /100 | #173 | Average 27.5% |
| Whites/Caucasians | 50.0 /100 | #174 | Average 27.4% |
| British | 49.9 /100 | #175 | Average 27.4% |
| Immigrants | China | 49.6 /100 | #176 | Average 27.4% |
| Ugandans | 49.2 /100 | #177 | Average 27.4% |