Immigrants from Burma/Myanmar vs Immigrants from Belize Family Households with Children
COMPARE
Immigrants from Burma/Myanmar
Immigrants from Belize
Family Households with Children
Family Households with Children Comparison
Immigrants from Burma/Myanmar
Immigrants from Belize
28.0%
FAMILY HOUSEHOLDS WITH CHILDREN
97.7/ 100
METRIC RATING
108th/ 347
METRIC RANK
27.7%
FAMILY HOUSEHOLDS WITH CHILDREN
85.7/ 100
METRIC RATING
132nd/ 347
METRIC RANK
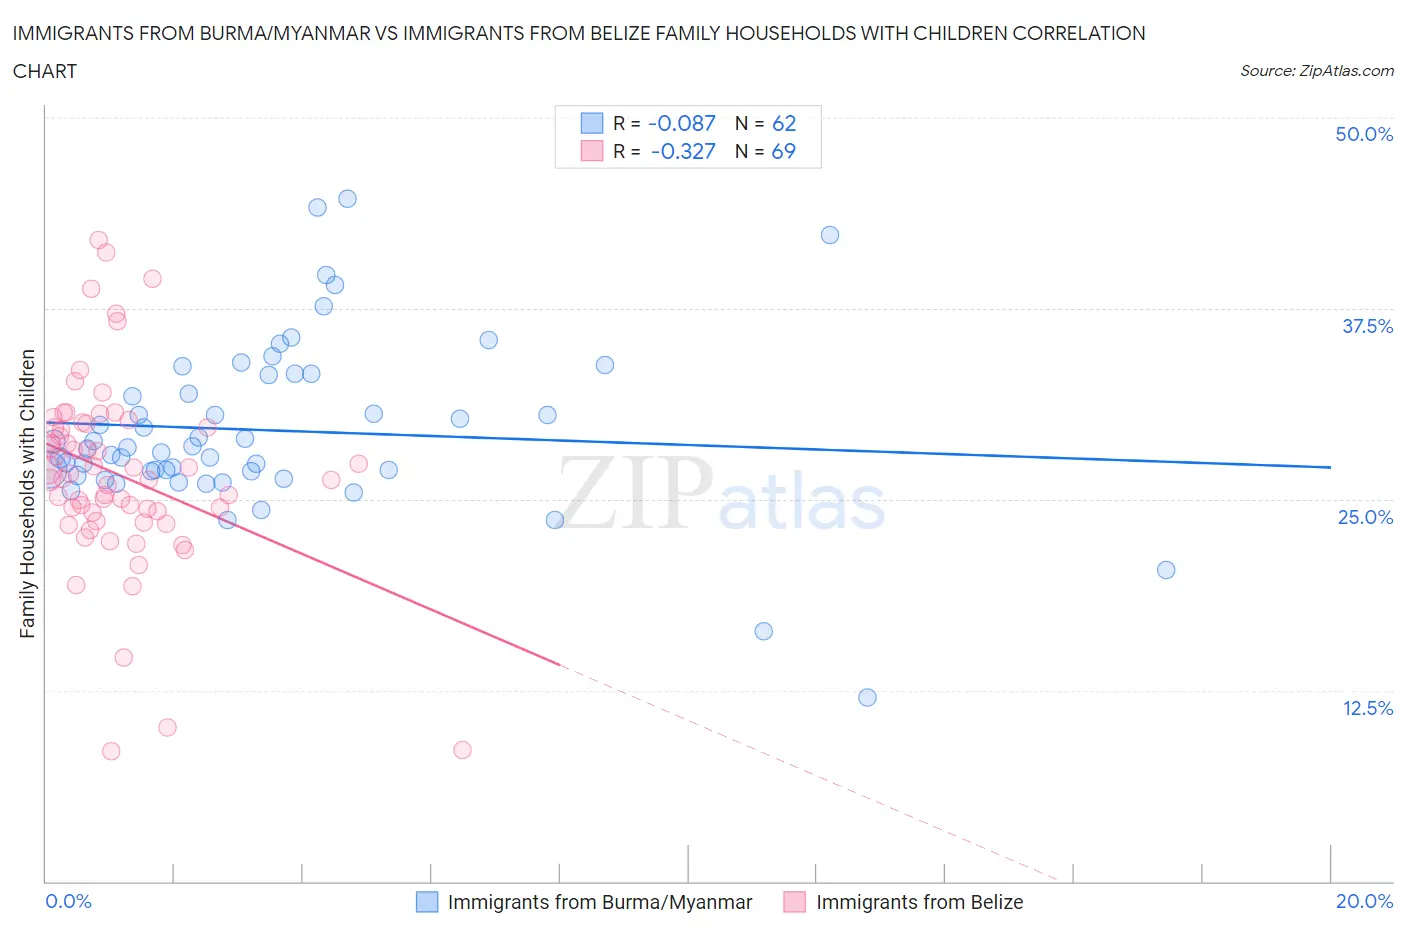
Immigrants from Burma/Myanmar vs Immigrants from Belize Family Households with Children Correlation Chart
The statistical analysis conducted on geographies consisting of 172,235,396 people shows a slight negative correlation between the proportion of Immigrants from Burma/Myanmar and percentage of family households with children in the United States with a correlation coefficient (R) of -0.087 and weighted average of 28.0%. Similarly, the statistical analysis conducted on geographies consisting of 130,285,570 people shows a mild negative correlation between the proportion of Immigrants from Belize and percentage of family households with children in the United States with a correlation coefficient (R) of -0.327 and weighted average of 27.7%, a difference of 1.1%.
Family Households with Children Correlation Summary
| Measurement | Immigrants from Burma/Myanmar | Immigrants from Belize |
| Minimum | 12.1% | 8.5% |
| Maximum | 44.7% | 42.0% |
| Range | 32.6% | 33.4% |
| Mean | 29.5% | 26.6% |
| Median | 28.3% | 26.4% |
| Interquartile 25% (IQ1) | 26.9% | 23.9% |
| Interquartile 75% (IQ3) | 33.1% | 29.9% |
| Interquartile Range (IQR) | 6.2% | 6.0% |
| Standard Deviation (Sample) | 5.7% | 6.3% |
| Standard Deviation (Population) | 5.6% | 6.2% |
Similar Demographics by Family Households with Children
Demographics Similar to Immigrants from Burma/Myanmar by Family Households with Children
In terms of family households with children, the demographic groups most similar to Immigrants from Burma/Myanmar are Immigrants from Uganda (28.0%, a difference of 0.010%), Tohono O'odham (28.0%, a difference of 0.010%), Spaniard (28.0%, a difference of 0.050%), Immigrants from South America (28.0%, a difference of 0.080%), and Scandinavian (28.0%, a difference of 0.11%).
| Demographics | Rating | Rank | Family Households with Children |
| Immigrants | Oceania | 98.8 /100 | #101 | Exceptional 28.1% |
| Assyrians/Chaldeans/Syriacs | 98.7 /100 | #102 | Exceptional 28.1% |
| Palestinians | 98.5 /100 | #103 | Exceptional 28.1% |
| Sioux | 98.3 /100 | #104 | Exceptional 28.1% |
| Choctaw | 98.3 /100 | #105 | Exceptional 28.1% |
| Immigrants | South America | 98.0 /100 | #106 | Exceptional 28.0% |
| Immigrants | Uganda | 97.7 /100 | #107 | Exceptional 28.0% |
| Immigrants | Burma/Myanmar | 97.7 /100 | #108 | Exceptional 28.0% |
| Tohono O'odham | 97.6 /100 | #109 | Exceptional 28.0% |
| Spaniards | 97.4 /100 | #110 | Exceptional 28.0% |
| Scandinavians | 97.1 /100 | #111 | Exceptional 28.0% |
| Immigrants | Middle Africa | 97.0 /100 | #112 | Exceptional 28.0% |
| Arabs | 97.0 /100 | #113 | Exceptional 28.0% |
| South American Indians | 96.9 /100 | #114 | Exceptional 28.0% |
| Immigrants | Africa | 96.8 /100 | #115 | Exceptional 28.0% |
Demographics Similar to Immigrants from Belize by Family Households with Children
In terms of family households with children, the demographic groups most similar to Immigrants from Belize are Iranian (27.7%, a difference of 0.020%), Immigrants from Panama (27.7%, a difference of 0.040%), Immigrants from Ecuador (27.7%, a difference of 0.050%), Immigrants from Portugal (27.7%, a difference of 0.070%), and Lebanese (27.7%, a difference of 0.080%).
| Demographics | Rating | Rank | Family Households with Children |
| Ecuadorians | 90.8 /100 | #125 | Exceptional 27.8% |
| Immigrants | Ethiopia | 90.5 /100 | #126 | Exceptional 27.8% |
| Belizeans | 90.0 /100 | #127 | Exceptional 27.8% |
| Syrians | 89.7 /100 | #128 | Excellent 27.8% |
| Immigrants | Eritrea | 89.4 /100 | #129 | Excellent 27.8% |
| Cajuns | 87.6 /100 | #130 | Excellent 27.7% |
| Lebanese | 87.4 /100 | #131 | Excellent 27.7% |
| Immigrants | Belize | 85.7 /100 | #132 | Excellent 27.7% |
| Iranians | 85.2 /100 | #133 | Excellent 27.7% |
| Immigrants | Panama | 84.9 /100 | #134 | Excellent 27.7% |
| Immigrants | Ecuador | 84.6 /100 | #135 | Excellent 27.7% |
| Immigrants | Portugal | 84.1 /100 | #136 | Excellent 27.7% |
| Immigrants | Dominican Republic | 83.9 /100 | #137 | Excellent 27.7% |
| Uruguayans | 83.2 /100 | #138 | Excellent 27.7% |
| Vietnamese | 82.6 /100 | #139 | Excellent 27.7% |