Immigrants from Burma/Myanmar vs Immigrants from Sweden Family Households with Children
COMPARE
Immigrants from Burma/Myanmar
Immigrants from Sweden
Family Households with Children
Family Households with Children Comparison
Immigrants from Burma/Myanmar
Immigrants from Sweden
28.0%
FAMILY HOUSEHOLDS WITH CHILDREN
97.7/ 100
METRIC RATING
108th/ 347
METRIC RANK
26.5%
FAMILY HOUSEHOLDS WITH CHILDREN
0.2/ 100
METRIC RATING
289th/ 347
METRIC RANK
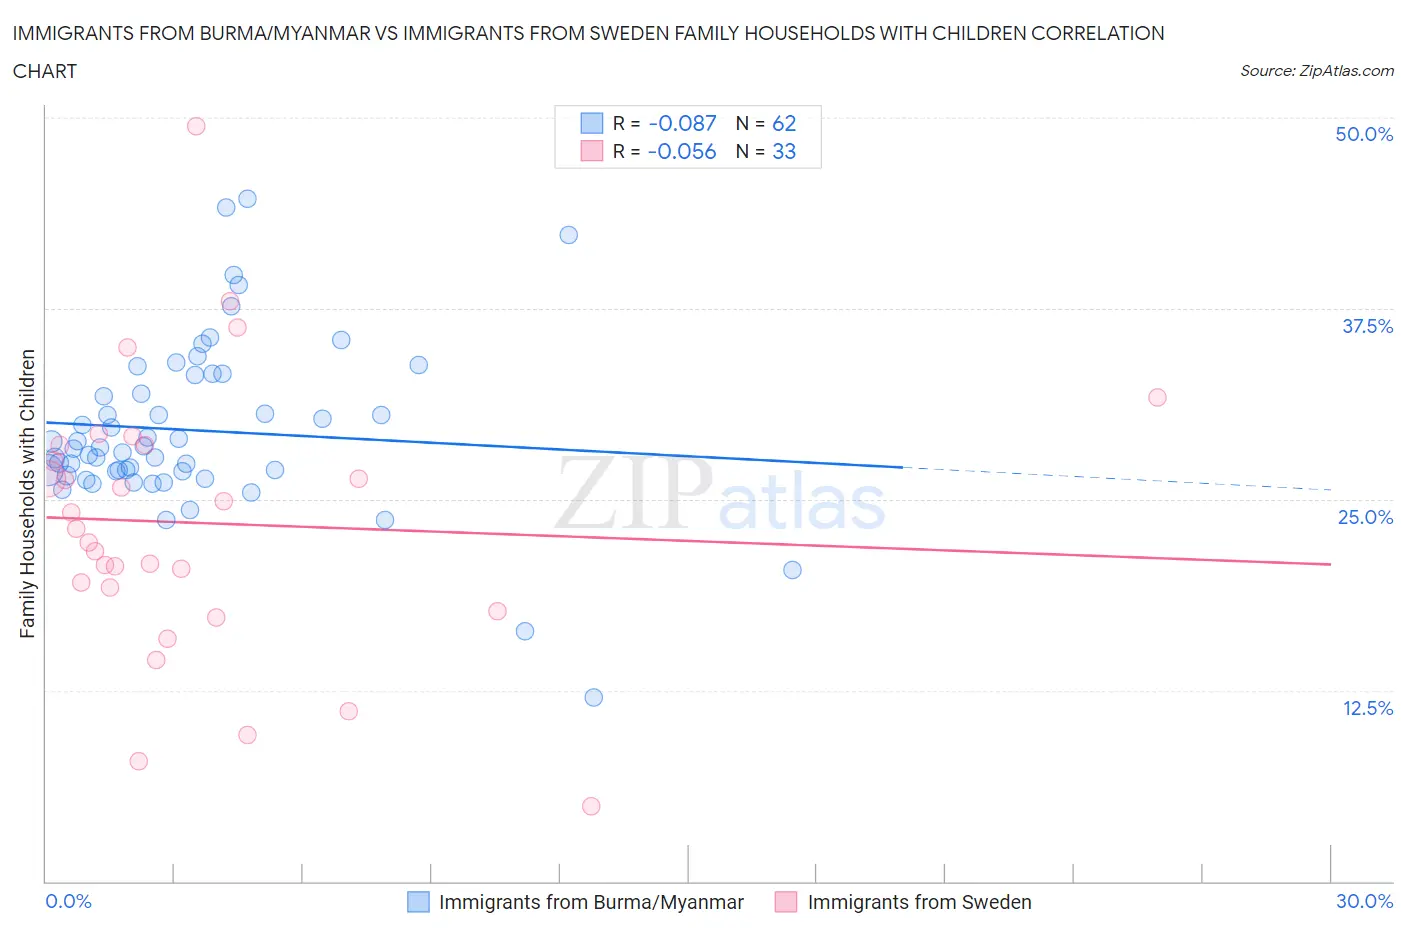
Immigrants from Burma/Myanmar vs Immigrants from Sweden Family Households with Children Correlation Chart
The statistical analysis conducted on geographies consisting of 172,235,396 people shows a slight negative correlation between the proportion of Immigrants from Burma/Myanmar and percentage of family households with children in the United States with a correlation coefficient (R) of -0.087 and weighted average of 28.0%. Similarly, the statistical analysis conducted on geographies consisting of 164,662,718 people shows a slight negative correlation between the proportion of Immigrants from Sweden and percentage of family households with children in the United States with a correlation coefficient (R) of -0.056 and weighted average of 26.5%, a difference of 5.7%.
Family Households with Children Correlation Summary
| Measurement | Immigrants from Burma/Myanmar | Immigrants from Sweden |
| Minimum | 12.1% | 4.9% |
| Maximum | 44.7% | 49.4% |
| Range | 32.6% | 44.5% |
| Mean | 29.5% | 23.4% |
| Median | 28.3% | 23.1% |
| Interquartile 25% (IQ1) | 26.9% | 18.4% |
| Interquartile 75% (IQ3) | 33.1% | 28.5% |
| Interquartile Range (IQR) | 6.2% | 10.1% |
| Standard Deviation (Sample) | 5.7% | 9.1% |
| Standard Deviation (Population) | 5.6% | 8.9% |
Similar Demographics by Family Households with Children
Demographics Similar to Immigrants from Burma/Myanmar by Family Households with Children
In terms of family households with children, the demographic groups most similar to Immigrants from Burma/Myanmar are Immigrants from Uganda (28.0%, a difference of 0.010%), Tohono O'odham (28.0%, a difference of 0.010%), Spaniard (28.0%, a difference of 0.050%), Immigrants from South America (28.0%, a difference of 0.080%), and Scandinavian (28.0%, a difference of 0.11%).
| Demographics | Rating | Rank | Family Households with Children |
| Immigrants | Oceania | 98.8 /100 | #101 | Exceptional 28.1% |
| Assyrians/Chaldeans/Syriacs | 98.7 /100 | #102 | Exceptional 28.1% |
| Palestinians | 98.5 /100 | #103 | Exceptional 28.1% |
| Sioux | 98.3 /100 | #104 | Exceptional 28.1% |
| Choctaw | 98.3 /100 | #105 | Exceptional 28.1% |
| Immigrants | South America | 98.0 /100 | #106 | Exceptional 28.0% |
| Immigrants | Uganda | 97.7 /100 | #107 | Exceptional 28.0% |
| Immigrants | Burma/Myanmar | 97.7 /100 | #108 | Exceptional 28.0% |
| Tohono O'odham | 97.6 /100 | #109 | Exceptional 28.0% |
| Spaniards | 97.4 /100 | #110 | Exceptional 28.0% |
| Scandinavians | 97.1 /100 | #111 | Exceptional 28.0% |
| Immigrants | Middle Africa | 97.0 /100 | #112 | Exceptional 28.0% |
| Arabs | 97.0 /100 | #113 | Exceptional 28.0% |
| South American Indians | 96.9 /100 | #114 | Exceptional 28.0% |
| Immigrants | Africa | 96.8 /100 | #115 | Exceptional 28.0% |
Demographics Similar to Immigrants from Sweden by Family Households with Children
In terms of family households with children, the demographic groups most similar to Immigrants from Sweden are Russian (26.5%, a difference of 0.050%), Immigrants from Senegal (26.5%, a difference of 0.070%), Shoshone (26.5%, a difference of 0.070%), Albanian (26.5%, a difference of 0.11%), and Cambodian (26.5%, a difference of 0.12%).
| Demographics | Rating | Rank | Family Households with Children |
| French American Indians | 0.3 /100 | #282 | Tragic 26.6% |
| Immigrants | North America | 0.3 /100 | #283 | Tragic 26.6% |
| Immigrants | Canada | 0.3 /100 | #284 | Tragic 26.5% |
| Cambodians | 0.2 /100 | #285 | Tragic 26.5% |
| Immigrants | Senegal | 0.2 /100 | #286 | Tragic 26.5% |
| Shoshone | 0.2 /100 | #287 | Tragic 26.5% |
| Russians | 0.2 /100 | #288 | Tragic 26.5% |
| Immigrants | Sweden | 0.2 /100 | #289 | Tragic 26.5% |
| Albanians | 0.2 /100 | #290 | Tragic 26.5% |
| Bahamians | 0.2 /100 | #291 | Tragic 26.5% |
| Poles | 0.2 /100 | #292 | Tragic 26.5% |
| Blacks/African Americans | 0.1 /100 | #293 | Tragic 26.5% |
| Latvians | 0.1 /100 | #294 | Tragic 26.4% |
| Macedonians | 0.1 /100 | #295 | Tragic 26.4% |
| Croatians | 0.1 /100 | #296 | Tragic 26.4% |