Immigrants from Burma/Myanmar vs Cherokee Seniors Poverty Over the Age of 75
COMPARE
Immigrants from Burma/Myanmar
Cherokee
Seniors Poverty Over the Age of 75
Seniors Poverty Over the Age of 75 Comparison
Immigrants from Burma/Myanmar
Cherokee
12.1%
SENIORS POVERTY OVER THE AGE OF 75
62.3/ 100
METRIC RATING
156th/ 347
METRIC RANK
12.0%
SENIORS POVERTY OVER THE AGE OF 75
65.8/ 100
METRIC RATING
151st/ 347
METRIC RANK
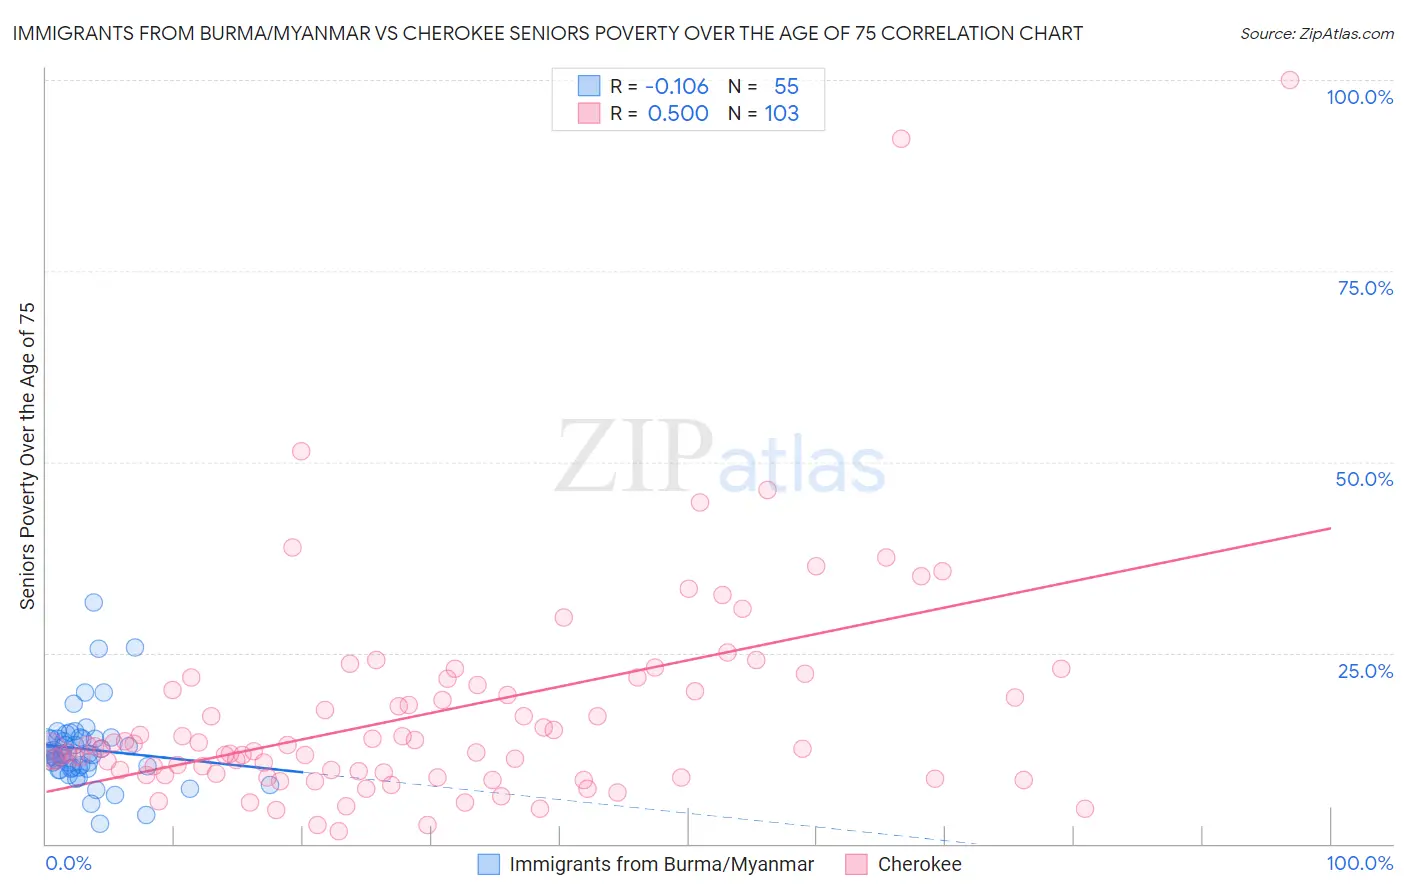
Immigrants from Burma/Myanmar vs Cherokee Seniors Poverty Over the Age of 75 Correlation Chart
The statistical analysis conducted on geographies consisting of 171,617,389 people shows a poor negative correlation between the proportion of Immigrants from Burma/Myanmar and poverty level among seniors over the age of 75 in the United States with a correlation coefficient (R) of -0.106 and weighted average of 12.1%. Similarly, the statistical analysis conducted on geographies consisting of 484,904,454 people shows a substantial positive correlation between the proportion of Cherokee and poverty level among seniors over the age of 75 in the United States with a correlation coefficient (R) of 0.500 and weighted average of 12.0%, a difference of 0.31%.
Seniors Poverty Over the Age of 75 Correlation Summary
| Measurement | Immigrants from Burma/Myanmar | Cherokee |
| Minimum | 2.6% | 1.7% |
| Maximum | 31.5% | 100.0% |
| Range | 28.9% | 98.3% |
| Mean | 12.4% | 17.2% |
| Median | 11.8% | 12.5% |
| Interquartile 25% (IQ1) | 9.8% | 9.0% |
| Interquartile 75% (IQ3) | 13.8% | 20.8% |
| Interquartile Range (IQR) | 4.0% | 11.8% |
| Standard Deviation (Sample) | 5.0% | 14.9% |
| Standard Deviation (Population) | 4.9% | 14.8% |
Demographics Similar to Immigrants from Burma/Myanmar and Cherokee by Seniors Poverty Over the Age of 75
In terms of seniors poverty over the age of 75, the demographic groups most similar to Immigrants from Burma/Myanmar are Indonesian (12.1%, a difference of 0.020%), Immigrants from Sudan (12.1%, a difference of 0.060%), Portuguese (12.1%, a difference of 0.090%), Immigrants from Middle Africa (12.1%, a difference of 0.10%), and Immigrants from Eastern Africa (12.1%, a difference of 0.13%). Similarly, the demographic groups most similar to Cherokee are Immigrants from Korea (12.0%, a difference of 0.030%), Immigrants from Turkey (12.0%, a difference of 0.10%), Cypriot (12.0%, a difference of 0.14%), Asian (12.0%, a difference of 0.15%), and Immigrants from Zaire (12.0%, a difference of 0.17%).
| Demographics | Rating | Rank | Seniors Poverty Over the Age of 75 |
| Americans | 71.0 /100 | #143 | Good 12.0% |
| Hmong | 70.8 /100 | #144 | Good 12.0% |
| Immigrants | Belgium | 70.8 /100 | #145 | Good 12.0% |
| Bangladeshis | 70.4 /100 | #146 | Good 12.0% |
| Immigrants | Latvia | 69.1 /100 | #147 | Good 12.0% |
| Immigrants | Zaire | 67.6 /100 | #148 | Good 12.0% |
| Asians | 67.4 /100 | #149 | Good 12.0% |
| Cypriots | 67.3 /100 | #150 | Good 12.0% |
| Cherokee | 65.8 /100 | #151 | Good 12.0% |
| Immigrants | Korea | 65.5 /100 | #152 | Good 12.0% |
| Immigrants | Turkey | 64.7 /100 | #153 | Good 12.0% |
| Cambodians | 64.0 /100 | #154 | Good 12.0% |
| Indonesians | 62.6 /100 | #155 | Good 12.1% |
| Immigrants | Burma/Myanmar | 62.3 /100 | #156 | Good 12.1% |
| Immigrants | Sudan | 61.7 /100 | #157 | Good 12.1% |
| Portuguese | 61.3 /100 | #158 | Good 12.1% |
| Immigrants | Middle Africa | 61.2 /100 | #159 | Good 12.1% |
| Immigrants | Eastern Africa | 60.9 /100 | #160 | Good 12.1% |
| Immigrants | Norway | 60.6 /100 | #161 | Good 12.1% |
| Immigrants | Serbia | 60.2 /100 | #162 | Good 12.1% |
| Immigrants | Greece | 58.2 /100 | #163 | Average 12.1% |