Immigrants from Burma/Myanmar vs Immigrants from Iran Family Households with Children
COMPARE
Immigrants from Burma/Myanmar
Immigrants from Iran
Family Households with Children
Family Households with Children Comparison
Immigrants from Burma/Myanmar
Immigrants from Iran
28.0%
FAMILY HOUSEHOLDS WITH CHILDREN
97.7/ 100
METRIC RATING
108th/ 347
METRIC RANK
27.4%
FAMILY HOUSEHOLDS WITH CHILDREN
36.1/ 100
METRIC RATING
194th/ 347
METRIC RANK
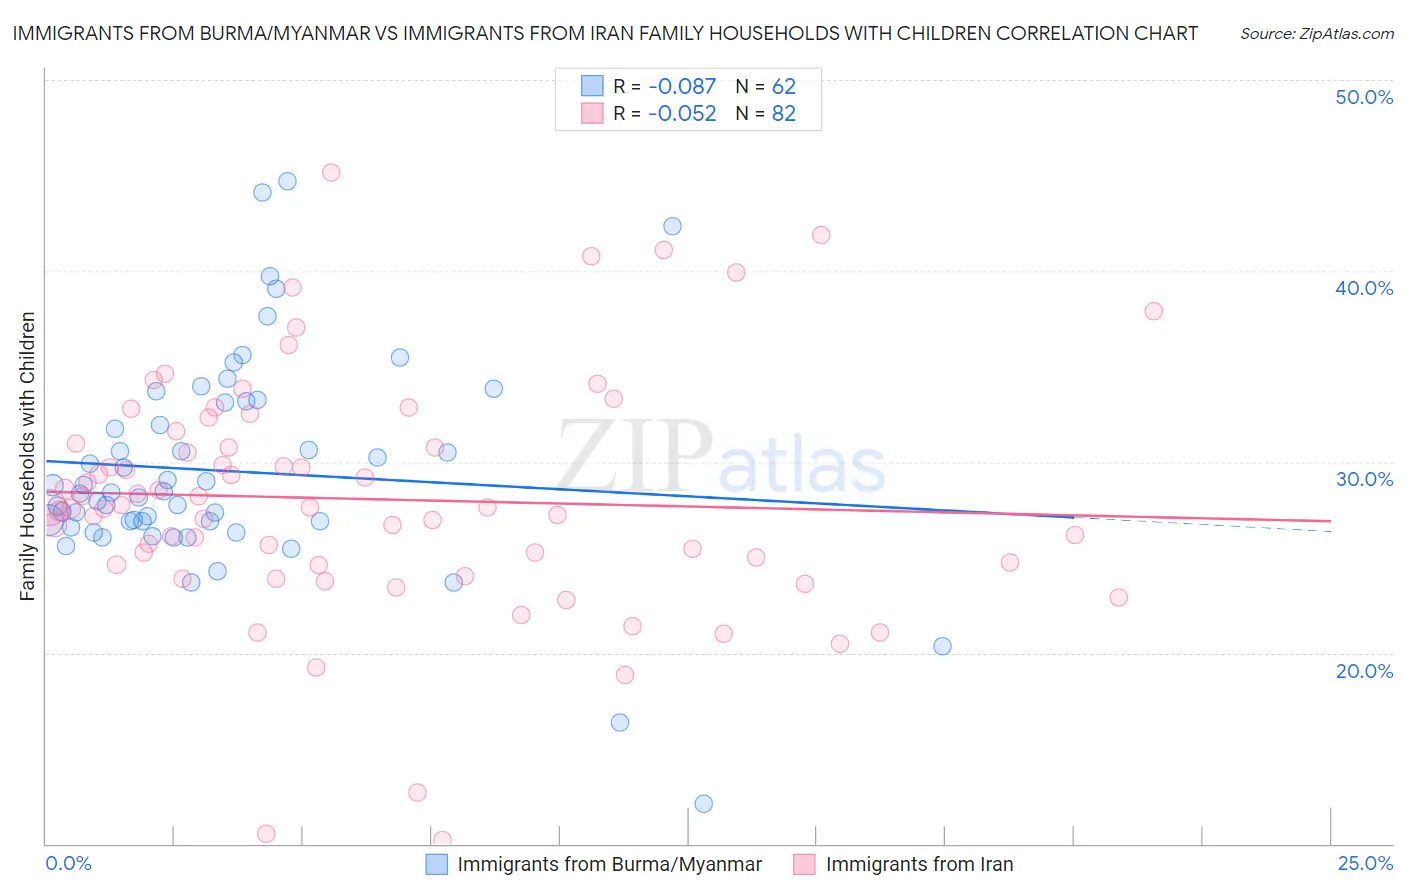
Immigrants from Burma/Myanmar vs Immigrants from Iran Family Households with Children Correlation Chart
The statistical analysis conducted on geographies consisting of 172,235,396 people shows a slight negative correlation between the proportion of Immigrants from Burma/Myanmar and percentage of family households with children in the United States with a correlation coefficient (R) of -0.087 and weighted average of 28.0%. Similarly, the statistical analysis conducted on geographies consisting of 279,767,231 people shows a slight negative correlation between the proportion of Immigrants from Iran and percentage of family households with children in the United States with a correlation coefficient (R) of -0.052 and weighted average of 27.4%, a difference of 2.4%.
Family Households with Children Correlation Summary
| Measurement | Immigrants from Burma/Myanmar | Immigrants from Iran |
| Minimum | 12.1% | 10.2% |
| Maximum | 44.7% | 45.2% |
| Range | 32.6% | 35.0% |
| Mean | 29.5% | 28.1% |
| Median | 28.3% | 27.6% |
| Interquartile 25% (IQ1) | 26.9% | 24.6% |
| Interquartile 75% (IQ3) | 33.1% | 30.9% |
| Interquartile Range (IQR) | 6.2% | 6.3% |
| Standard Deviation (Sample) | 5.7% | 6.3% |
| Standard Deviation (Population) | 5.6% | 6.3% |
Similar Demographics by Family Households with Children
Demographics Similar to Immigrants from Burma/Myanmar by Family Households with Children
In terms of family households with children, the demographic groups most similar to Immigrants from Burma/Myanmar are Immigrants from Uganda (28.0%, a difference of 0.010%), Tohono O'odham (28.0%, a difference of 0.010%), Spaniard (28.0%, a difference of 0.050%), Immigrants from South America (28.0%, a difference of 0.080%), and Scandinavian (28.0%, a difference of 0.11%).
| Demographics | Rating | Rank | Family Households with Children |
| Immigrants | Oceania | 98.8 /100 | #101 | Exceptional 28.1% |
| Assyrians/Chaldeans/Syriacs | 98.7 /100 | #102 | Exceptional 28.1% |
| Palestinians | 98.5 /100 | #103 | Exceptional 28.1% |
| Sioux | 98.3 /100 | #104 | Exceptional 28.1% |
| Choctaw | 98.3 /100 | #105 | Exceptional 28.1% |
| Immigrants | South America | 98.0 /100 | #106 | Exceptional 28.0% |
| Immigrants | Uganda | 97.7 /100 | #107 | Exceptional 28.0% |
| Immigrants | Burma/Myanmar | 97.7 /100 | #108 | Exceptional 28.0% |
| Tohono O'odham | 97.6 /100 | #109 | Exceptional 28.0% |
| Spaniards | 97.4 /100 | #110 | Exceptional 28.0% |
| Scandinavians | 97.1 /100 | #111 | Exceptional 28.0% |
| Immigrants | Middle Africa | 97.0 /100 | #112 | Exceptional 28.0% |
| Arabs | 97.0 /100 | #113 | Exceptional 28.0% |
| South American Indians | 96.9 /100 | #114 | Exceptional 28.0% |
| Immigrants | Africa | 96.8 /100 | #115 | Exceptional 28.0% |
Demographics Similar to Immigrants from Iran by Family Households with Children
In terms of family households with children, the demographic groups most similar to Immigrants from Iran are Crow (27.4%, a difference of 0.010%), Swedish (27.4%, a difference of 0.020%), Cheyenne (27.4%, a difference of 0.020%), Pennsylvania German (27.4%, a difference of 0.030%), and Norwegian (27.4%, a difference of 0.030%).
| Demographics | Rating | Rank | Family Households with Children |
| Creek | 39.8 /100 | #187 | Fair 27.4% |
| Dutch | 38.8 /100 | #188 | Fair 27.4% |
| Immigrants | Israel | 37.9 /100 | #189 | Fair 27.4% |
| Immigrants | Uruguay | 37.7 /100 | #190 | Fair 27.4% |
| Sudanese | 37.6 /100 | #191 | Fair 27.4% |
| Pennsylvania Germans | 37.5 /100 | #192 | Fair 27.4% |
| Swedes | 36.9 /100 | #193 | Fair 27.4% |
| Immigrants | Iran | 36.1 /100 | #194 | Fair 27.4% |
| Crow | 35.7 /100 | #195 | Fair 27.4% |
| Cheyenne | 35.1 /100 | #196 | Fair 27.4% |
| Norwegians | 35.0 /100 | #197 | Fair 27.4% |
| Immigrants | Romania | 34.4 /100 | #198 | Fair 27.4% |
| English | 32.0 /100 | #199 | Fair 27.3% |
| Immigrants | Congo | 28.7 /100 | #200 | Fair 27.3% |
| Bhutanese | 25.1 /100 | #201 | Fair 27.3% |