Guamanian/Chamorro vs Immigrants from Ghana Family Households with Children
COMPARE
Guamanian/Chamorro
Immigrants from Ghana
Family Households with Children
Family Households with Children Comparison
Guamanians/Chamorros
Immigrants from Ghana
29.7%
FAMILY HOUSEHOLDS WITH CHILDREN
100.0/ 100
METRIC RATING
24th/ 347
METRIC RANK
28.6%
FAMILY HOUSEHOLDS WITH CHILDREN
99.9/ 100
METRIC RATING
61st/ 347
METRIC RANK
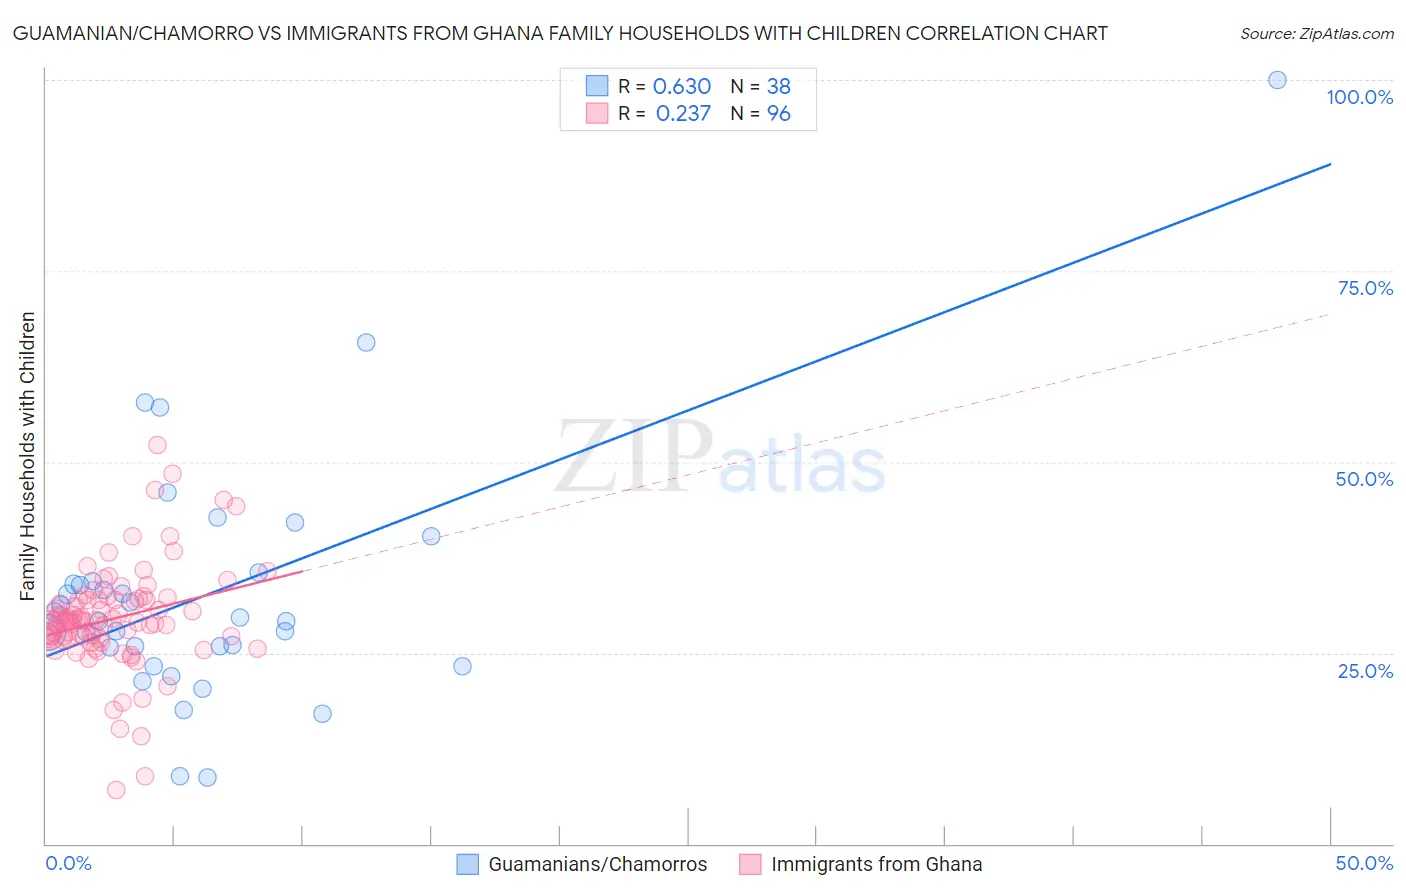
Guamanian/Chamorro vs Immigrants from Ghana Family Households with Children Correlation Chart
The statistical analysis conducted on geographies consisting of 221,827,817 people shows a significant positive correlation between the proportion of Guamanians/Chamorros and percentage of family households with children in the United States with a correlation coefficient (R) of 0.630 and weighted average of 29.7%. Similarly, the statistical analysis conducted on geographies consisting of 199,783,452 people shows a weak positive correlation between the proportion of Immigrants from Ghana and percentage of family households with children in the United States with a correlation coefficient (R) of 0.237 and weighted average of 28.6%, a difference of 4.0%.
Family Households with Children Correlation Summary
| Measurement | Guamanian/Chamorro | Immigrants from Ghana |
| Minimum | 8.6% | 7.0% |
| Maximum | 100.0% | 52.2% |
| Range | 91.4% | 45.3% |
| Mean | 32.8% | 29.5% |
| Median | 29.4% | 29.1% |
| Interquartile 25% (IQ1) | 25.8% | 26.8% |
| Interquartile 75% (IQ3) | 34.4% | 31.9% |
| Interquartile Range (IQR) | 8.7% | 5.2% |
| Standard Deviation (Sample) | 16.3% | 6.9% |
| Standard Deviation (Population) | 16.1% | 6.9% |
Similar Demographics by Family Households with Children
Demographics Similar to Guamanians/Chamorros by Family Households with Children
In terms of family households with children, the demographic groups most similar to Guamanians/Chamorros are Mexican American Indian (29.7%, a difference of 0.10%), Immigrants from Latin America (29.7%, a difference of 0.10%), Malaysian (29.8%, a difference of 0.37%), Immigrants from Laos (29.8%, a difference of 0.41%), and Immigrants from El Salvador (29.8%, a difference of 0.45%).
| Demographics | Rating | Rank | Family Households with Children |
| Hispanics or Latinos | 100.0 /100 | #17 | Exceptional 29.9% |
| Salvadorans | 100.0 /100 | #18 | Exceptional 29.9% |
| Alaska Natives | 100.0 /100 | #19 | Exceptional 29.9% |
| Immigrants | El Salvador | 100.0 /100 | #20 | Exceptional 29.8% |
| Immigrants | Laos | 100.0 /100 | #21 | Exceptional 29.8% |
| Malaysians | 100.0 /100 | #22 | Exceptional 29.8% |
| Mexican American Indians | 100.0 /100 | #23 | Exceptional 29.7% |
| Guamanians/Chamorros | 100.0 /100 | #24 | Exceptional 29.7% |
| Immigrants | Latin America | 100.0 /100 | #25 | Exceptional 29.7% |
| Sri Lankans | 100.0 /100 | #26 | Exceptional 29.5% |
| Immigrants | Vietnam | 100.0 /100 | #27 | Exceptional 29.5% |
| Samoans | 100.0 /100 | #28 | Exceptional 29.5% |
| Bolivians | 100.0 /100 | #29 | Exceptional 29.5% |
| Yuman | 100.0 /100 | #30 | Exceptional 29.5% |
| Japanese | 100.0 /100 | #31 | Exceptional 29.4% |
Demographics Similar to Immigrants from Ghana by Family Households with Children
In terms of family households with children, the demographic groups most similar to Immigrants from Ghana are Egyptian (28.6%, a difference of 0.0%), Immigrants from Lebanon (28.6%, a difference of 0.010%), Hmong (28.6%, a difference of 0.070%), Filipino (28.6%, a difference of 0.080%), and Immigrants from Nigeria (28.6%, a difference of 0.13%).
| Demographics | Rating | Rank | Family Households with Children |
| Sierra Leoneans | 100.0 /100 | #54 | Exceptional 28.9% |
| Immigrants | Asia | 100.0 /100 | #55 | Exceptional 28.8% |
| Immigrants | Guatemala | 100.0 /100 | #56 | Exceptional 28.8% |
| Danes | 100.0 /100 | #57 | Exceptional 28.7% |
| Hawaiians | 100.0 /100 | #58 | Exceptional 28.7% |
| Immigrants | Nigeria | 100.0 /100 | #59 | Exceptional 28.6% |
| Hmong | 99.9 /100 | #60 | Exceptional 28.6% |
| Immigrants | Ghana | 99.9 /100 | #61 | Exceptional 28.6% |
| Egyptians | 99.9 /100 | #62 | Exceptional 28.6% |
| Immigrants | Lebanon | 99.9 /100 | #63 | Exceptional 28.6% |
| Filipinos | 99.9 /100 | #64 | Exceptional 28.6% |
| Hondurans | 99.9 /100 | #65 | Exceptional 28.5% |
| Immigrants | Egypt | 99.9 /100 | #66 | Exceptional 28.5% |
| Ghanaians | 99.9 /100 | #67 | Exceptional 28.5% |
| Houma | 99.9 /100 | #68 | Exceptional 28.5% |