Immigrants from Germany vs Immigrants from Ghana Family Households with Children
COMPARE
Immigrants from Germany
Immigrants from Ghana
Family Households with Children
Family Households with Children Comparison
Immigrants from Germany
Immigrants from Ghana
27.0%
FAMILY HOUSEHOLDS WITH CHILDREN
4.4/ 100
METRIC RATING
234th/ 347
METRIC RANK
28.6%
FAMILY HOUSEHOLDS WITH CHILDREN
99.9/ 100
METRIC RATING
61st/ 347
METRIC RANK
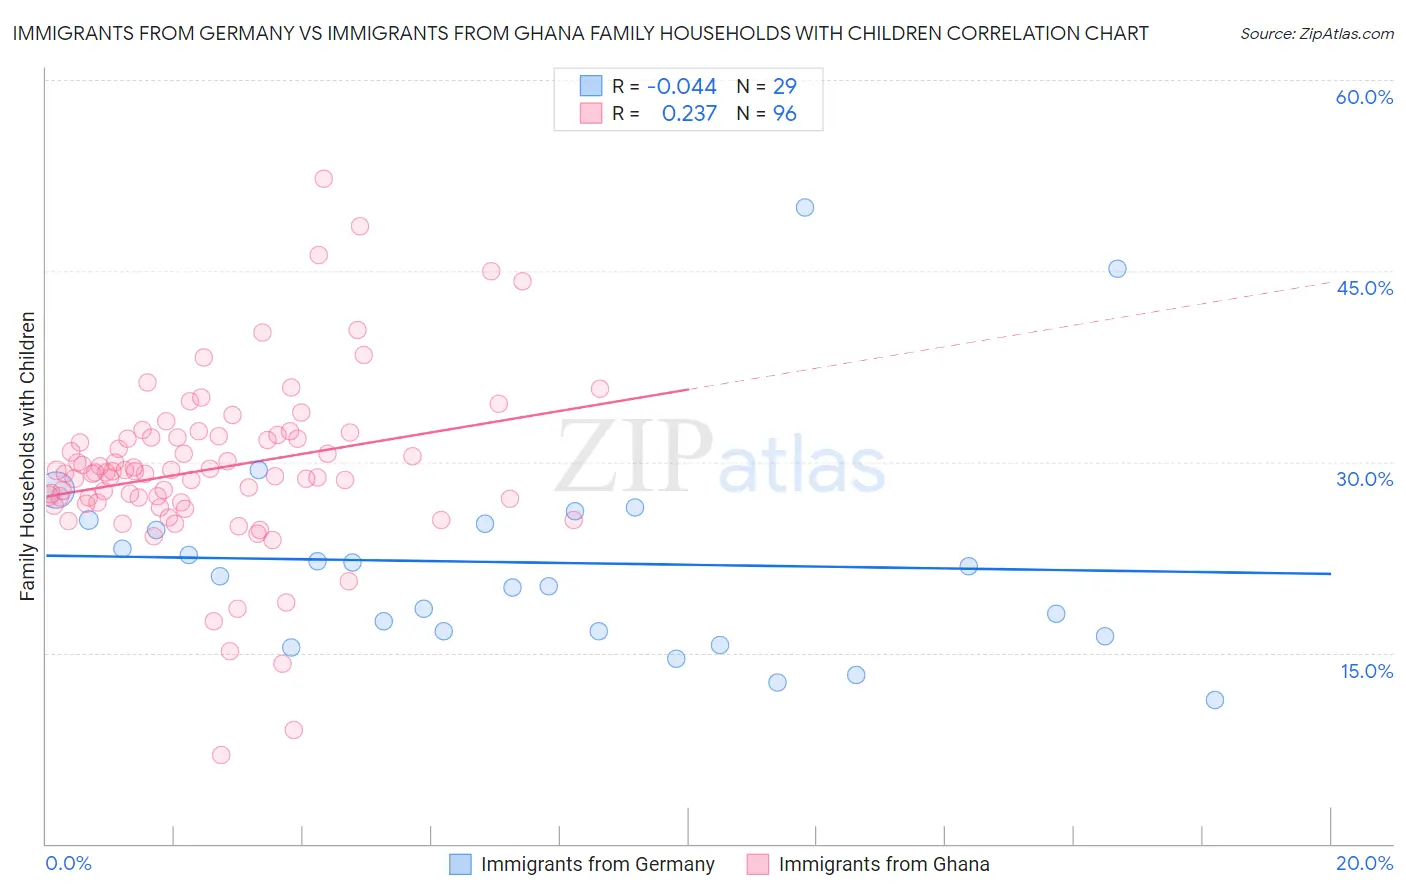
Immigrants from Germany vs Immigrants from Ghana Family Households with Children Correlation Chart
The statistical analysis conducted on geographies consisting of 463,563,782 people shows no correlation between the proportion of Immigrants from Germany and percentage of family households with children in the United States with a correlation coefficient (R) of -0.044 and weighted average of 27.0%. Similarly, the statistical analysis conducted on geographies consisting of 199,783,452 people shows a weak positive correlation between the proportion of Immigrants from Ghana and percentage of family households with children in the United States with a correlation coefficient (R) of 0.237 and weighted average of 28.6%, a difference of 5.9%.
Family Households with Children Correlation Summary
| Measurement | Immigrants from Germany | Immigrants from Ghana |
| Minimum | 11.3% | 7.0% |
| Maximum | 50.0% | 52.2% |
| Range | 38.7% | 45.3% |
| Mean | 22.1% | 29.5% |
| Median | 21.0% | 29.1% |
| Interquartile 25% (IQ1) | 16.5% | 26.8% |
| Interquartile 75% (IQ3) | 25.3% | 31.9% |
| Interquartile Range (IQR) | 8.8% | 5.2% |
| Standard Deviation (Sample) | 8.5% | 6.9% |
| Standard Deviation (Population) | 8.4% | 6.9% |
Similar Demographics by Family Households with Children
Demographics Similar to Immigrants from Germany by Family Households with Children
In terms of family households with children, the demographic groups most similar to Immigrants from Germany are Immigrants from Morocco (27.0%, a difference of 0.040%), Yugoslavian (27.0%, a difference of 0.080%), Immigrants from Italy (27.0%, a difference of 0.080%), Luxembourger (27.0%, a difference of 0.13%), and Cape Verdean (26.9%, a difference of 0.13%).
| Demographics | Rating | Rank | Family Households with Children |
| Tsimshian | 6.6 /100 | #227 | Tragic 27.0% |
| Scottish | 6.5 /100 | #228 | Tragic 27.0% |
| Immigrants | Caribbean | 6.3 /100 | #229 | Tragic 27.0% |
| Bulgarians | 5.8 /100 | #230 | Tragic 27.0% |
| Luxembourgers | 5.5 /100 | #231 | Tragic 27.0% |
| Yugoslavians | 5.1 /100 | #232 | Tragic 27.0% |
| Immigrants | Italy | 5.0 /100 | #233 | Tragic 27.0% |
| Immigrants | Germany | 4.4 /100 | #234 | Tragic 27.0% |
| Immigrants | Morocco | 4.2 /100 | #235 | Tragic 27.0% |
| Cape Verdeans | 3.6 /100 | #236 | Tragic 26.9% |
| Immigrants | Netherlands | 3.5 /100 | #237 | Tragic 26.9% |
| Moroccans | 3.4 /100 | #238 | Tragic 26.9% |
| Immigrants | Southern Europe | 3.4 /100 | #239 | Tragic 26.9% |
| Immigrants | Bulgaria | 3.3 /100 | #240 | Tragic 26.9% |
| Navajo | 3.2 /100 | #241 | Tragic 26.9% |
Demographics Similar to Immigrants from Ghana by Family Households with Children
In terms of family households with children, the demographic groups most similar to Immigrants from Ghana are Egyptian (28.6%, a difference of 0.0%), Immigrants from Lebanon (28.6%, a difference of 0.010%), Hmong (28.6%, a difference of 0.070%), Filipino (28.6%, a difference of 0.080%), and Immigrants from Nigeria (28.6%, a difference of 0.13%).
| Demographics | Rating | Rank | Family Households with Children |
| Sierra Leoneans | 100.0 /100 | #54 | Exceptional 28.9% |
| Immigrants | Asia | 100.0 /100 | #55 | Exceptional 28.8% |
| Immigrants | Guatemala | 100.0 /100 | #56 | Exceptional 28.8% |
| Danes | 100.0 /100 | #57 | Exceptional 28.7% |
| Hawaiians | 100.0 /100 | #58 | Exceptional 28.7% |
| Immigrants | Nigeria | 100.0 /100 | #59 | Exceptional 28.6% |
| Hmong | 99.9 /100 | #60 | Exceptional 28.6% |
| Immigrants | Ghana | 99.9 /100 | #61 | Exceptional 28.6% |
| Egyptians | 99.9 /100 | #62 | Exceptional 28.6% |
| Immigrants | Lebanon | 99.9 /100 | #63 | Exceptional 28.6% |
| Filipinos | 99.9 /100 | #64 | Exceptional 28.6% |
| Hondurans | 99.9 /100 | #65 | Exceptional 28.5% |
| Immigrants | Egypt | 99.9 /100 | #66 | Exceptional 28.5% |
| Ghanaians | 99.9 /100 | #67 | Exceptional 28.5% |
| Houma | 99.9 /100 | #68 | Exceptional 28.5% |