Guamanian/Chamorro vs Immigrants from Czechoslovakia Family Households with Children
COMPARE
Guamanian/Chamorro
Immigrants from Czechoslovakia
Family Households with Children
Family Households with Children Comparison
Guamanians/Chamorros
Immigrants from Czechoslovakia
29.7%
FAMILY HOUSEHOLDS WITH CHILDREN
100.0/ 100
METRIC RATING
24th/ 347
METRIC RANK
26.2%
FAMILY HOUSEHOLDS WITH CHILDREN
0.0/ 100
METRIC RATING
312th/ 347
METRIC RANK
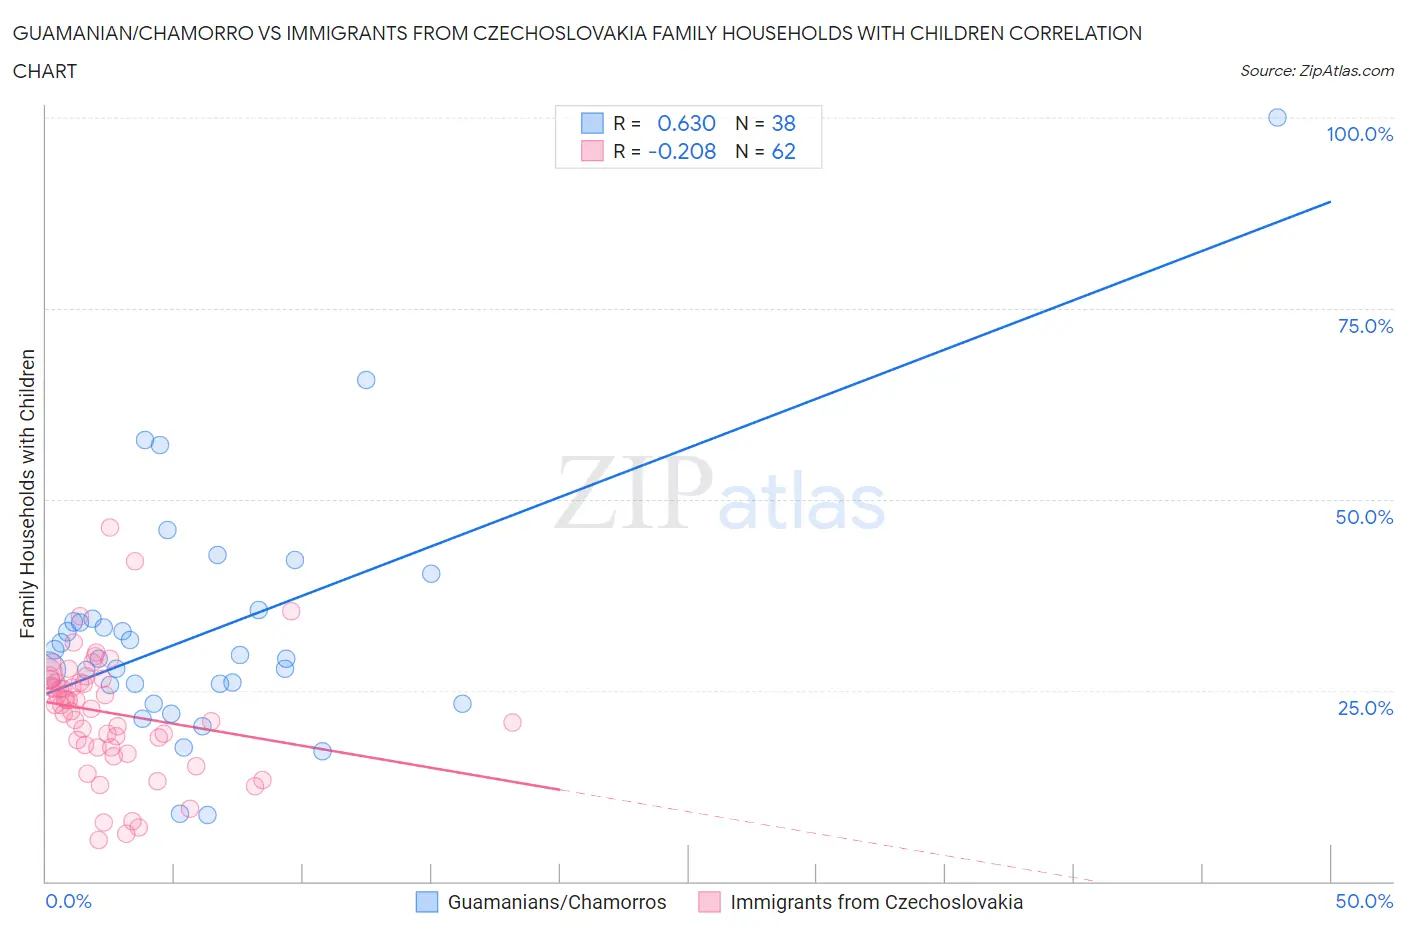
Guamanian/Chamorro vs Immigrants from Czechoslovakia Family Households with Children Correlation Chart
The statistical analysis conducted on geographies consisting of 221,827,817 people shows a significant positive correlation between the proportion of Guamanians/Chamorros and percentage of family households with children in the United States with a correlation coefficient (R) of 0.630 and weighted average of 29.7%. Similarly, the statistical analysis conducted on geographies consisting of 195,398,985 people shows a weak negative correlation between the proportion of Immigrants from Czechoslovakia and percentage of family households with children in the United States with a correlation coefficient (R) of -0.208 and weighted average of 26.2%, a difference of 13.3%.
Family Households with Children Correlation Summary
| Measurement | Guamanian/Chamorro | Immigrants from Czechoslovakia |
| Minimum | 8.6% | 5.5% |
| Maximum | 100.0% | 46.3% |
| Range | 91.4% | 40.8% |
| Mean | 32.8% | 22.0% |
| Median | 29.4% | 23.1% |
| Interquartile 25% (IQ1) | 25.8% | 17.6% |
| Interquartile 75% (IQ3) | 34.4% | 26.4% |
| Interquartile Range (IQR) | 8.7% | 8.8% |
| Standard Deviation (Sample) | 16.3% | 8.0% |
| Standard Deviation (Population) | 16.1% | 7.9% |
Similar Demographics by Family Households with Children
Demographics Similar to Guamanians/Chamorros by Family Households with Children
In terms of family households with children, the demographic groups most similar to Guamanians/Chamorros are Mexican American Indian (29.7%, a difference of 0.10%), Immigrants from Latin America (29.7%, a difference of 0.10%), Malaysian (29.8%, a difference of 0.37%), Immigrants from Laos (29.8%, a difference of 0.41%), and Immigrants from El Salvador (29.8%, a difference of 0.45%).
| Demographics | Rating | Rank | Family Households with Children |
| Hispanics or Latinos | 100.0 /100 | #17 | Exceptional 29.9% |
| Salvadorans | 100.0 /100 | #18 | Exceptional 29.9% |
| Alaska Natives | 100.0 /100 | #19 | Exceptional 29.9% |
| Immigrants | El Salvador | 100.0 /100 | #20 | Exceptional 29.8% |
| Immigrants | Laos | 100.0 /100 | #21 | Exceptional 29.8% |
| Malaysians | 100.0 /100 | #22 | Exceptional 29.8% |
| Mexican American Indians | 100.0 /100 | #23 | Exceptional 29.7% |
| Guamanians/Chamorros | 100.0 /100 | #24 | Exceptional 29.7% |
| Immigrants | Latin America | 100.0 /100 | #25 | Exceptional 29.7% |
| Sri Lankans | 100.0 /100 | #26 | Exceptional 29.5% |
| Immigrants | Vietnam | 100.0 /100 | #27 | Exceptional 29.5% |
| Samoans | 100.0 /100 | #28 | Exceptional 29.5% |
| Bolivians | 100.0 /100 | #29 | Exceptional 29.5% |
| Yuman | 100.0 /100 | #30 | Exceptional 29.5% |
| Japanese | 100.0 /100 | #31 | Exceptional 29.4% |
Demographics Similar to Immigrants from Czechoslovakia by Family Households with Children
In terms of family households with children, the demographic groups most similar to Immigrants from Czechoslovakia are Colville (26.2%, a difference of 0.070%), Marshallese (26.2%, a difference of 0.12%), Immigrants from Somalia (26.3%, a difference of 0.16%), Cree (26.2%, a difference of 0.26%), and Lumbee (26.3%, a difference of 0.27%).
| Demographics | Rating | Rank | Family Households with Children |
| Guyanese | 0.1 /100 | #305 | Tragic 26.3% |
| Bermudans | 0.1 /100 | #306 | Tragic 26.3% |
| West Indians | 0.0 /100 | #307 | Tragic 26.3% |
| Lumbee | 0.0 /100 | #308 | Tragic 26.3% |
| Immigrants | Somalia | 0.0 /100 | #309 | Tragic 26.3% |
| Marshallese | 0.0 /100 | #310 | Tragic 26.2% |
| Colville | 0.0 /100 | #311 | Tragic 26.2% |
| Immigrants | Czechoslovakia | 0.0 /100 | #312 | Tragic 26.2% |
| Cree | 0.0 /100 | #313 | Tragic 26.2% |
| French Canadians | 0.0 /100 | #314 | Tragic 26.1% |
| Immigrants | Norway | 0.0 /100 | #315 | Tragic 26.1% |
| Estonians | 0.0 /100 | #316 | Tragic 26.1% |
| Ottawa | 0.0 /100 | #317 | Tragic 26.1% |
| Iroquois | 0.0 /100 | #318 | Tragic 26.1% |
| Immigrants | France | 0.0 /100 | #319 | Tragic 26.0% |