Black/African American vs Immigrants from Ghana Family Households with Children

COMPARE

Black/African American
Race
Ancestry
AfghanAfricanAlaska NativeAlaskan AthabascanAlbanianAleutAlsatianAmericanApacheArabArapahoArgentineanArmenianAssyrian/Chaldean/SyriacAustralianAustrianBahamianBangladeshiBarbadianBasqueBelgianBelizeanBermudanBhutaneseBlackfeetBolivianBrazilianBritishBritish West IndianBulgarianBurmeseCajunCambodianCanadianCape VerdeanCarpatho RusynCelticCentral AmericanCentral American IndianCherokeeCheyenneChickasawChileanChineseChippewaChoctawColombianColvilleComancheCosta RicanCreeCreekCroatianCrowCubanCypriotCzechCzechoslovakianDanishDelawareDominicanDutchDutch West IndianEastern EuropeanEcuadorianEgyptianEnglishEstonianEthiopianEuropeanFijianFilipinoFinnishFrenchFrench American IndianFrench CanadianGermanGerman RussianGhanaianGreekGuamanian/ChamorroGuatemalanGuyaneseHaitianHmongHonduranHopiHoumaHungarianIcelanderIndian (Asian)IndonesianInupiatIranianIraqiIrishIroquoisIsraeliItalianJamaicanJapaneseJordanianKenyanKiowaKoreanLaotianLatvianLebaneseLiberianLithuanianLumbeeLuxembourgerMacedonianMalaysianMalteseMarshalleseMenomineeMexicanMexican American IndianMongolianMoroccanNative HawaiianNavajoNepaleseNew ZealanderNicaraguanNigerianNorthern EuropeanNorwegianOkinawanOsageOttawaPaiutePakistaniPalestinianPanamanianParaguayanPennsylvania GermanPeruvianPimaPolishPortuguesePotawatomiPuebloPuerto RicanPuget Sound SalishRomanianRussianSalvadoranSamoanScandinavianScotch-IrishScottishSeminoleSenegaleseSerbianShoshoneSierra LeoneanSiouxSlavicSlovakSloveneSomaliSouth AfricanSouth AmericanSouth American IndianSoviet UnionSpaniardSpanishSpanish AmericanSpanish American IndianSri LankanSubsaharan AfricanSudaneseSwedishSwissSyrianTaiwaneseThaiTlingit-HaidaTohono O'OdhamTonganTrinidadian and TobagonianTsimshianTurkishU.S. Virgin IslanderUgandanUkrainianUruguayanUteVenezuelanVietnameseWelshWest IndianYakamaYaquiYugoslavianYumanYup'ikZimbabwean
Immigration
NonimmigrantsImmigrantsAfghanistanAfricaAlbaniaArgentinaArmeniaAsiaAustraliaAustriaBahamasBangladeshBarbadosBelarusBelgiumBelizeBoliviaBosnia and HerzegovinaBrazilBulgariaBurma/MyanmarCabo VerdeCambodiaCameroonCanadaCaribbeanCentral AmericaChileChinaColombiaCongoCosta RicaCroatiaCubaCzechoslovakiaDenmarkDominicaDominican RepublicEastern AfricaEastern AsiaEastern EuropeEcuadorEgyptEl SalvadorEnglandEritreaEthiopiaEuropeFijiFranceGermanyGreeceGrenadaGuatemalaGuyanaHaitiHondurasHong KongHungaryIndiaIndonesiaIranIraqIrelandIsraelItalyJamaicaJapanJordanKazakhstanKenyaKoreaKuwaitLaosLatin AmericaLatviaLebanonLiberiaLithuaniaMalaysiaMexicoMicronesiaMiddle AfricaMoldovaMoroccoNepalNetherlandsNicaraguaNigeriaNorth AmericaNorth MacedoniaNorthern AfricaNorthern EuropeNorwayOceaniaPakistanPanamaPeruPhilippinesPolandPortugalRomaniaRussiaSaudi ArabiaScotlandSenegalSerbiaSierra LeoneSingaporeSomaliaSouth AfricaSouth AmericaSouth Central AsiaSouth Eastern AsiaSouthern EuropeSpainSri LankaSt. Vincent and the GrenadinesSudanSwedenSwitzerlandSyriaTaiwanThailandTrinidad and TobagoTurkeyUgandaUkraineUruguayUzbekistanVenezuelaVietnamWest IndiesWestern AfricaWestern AsiaWestern EuropeYemenZaireZimbabweAzores
Immigrants from Ghana
Race
Ancestry
AfghanAfricanAlaska NativeAlaskan AthabascanAlbanianAleutAlsatianAmericanApacheArabArapahoArgentineanArmenianAssyrian/Chaldean/SyriacAustralianAustrianBahamianBangladeshiBarbadianBasqueBelgianBelizeanBermudanBhutaneseBlackfeetBolivianBrazilianBritishBritish West IndianBulgarianBurmeseCajunCambodianCanadianCape VerdeanCarpatho RusynCelticCentral AmericanCentral American IndianCherokeeCheyenneChickasawChileanChineseChippewaChoctawColombianColvilleComancheCosta RicanCreeCreekCroatianCrowCubanCypriotCzechCzechoslovakianDanishDelawareDominicanDutchDutch West IndianEastern EuropeanEcuadorianEgyptianEnglishEstonianEthiopianEuropeanFijianFilipinoFinnishFrenchFrench American IndianFrench CanadianGermanGerman RussianGhanaianGreekGuamanian/ChamorroGuatemalanGuyaneseHaitianHmongHonduranHopiHoumaHungarianIcelanderIndian (Asian)IndonesianInupiatIranianIraqiIrishIroquoisIsraeliItalianJamaicanJapaneseJordanianKenyanKiowaKoreanLaotianLatvianLebaneseLiberianLithuanianLumbeeLuxembourgerMacedonianMalaysianMalteseMarshalleseMenomineeMexicanMexican American IndianMongolianMoroccanNative HawaiianNavajoNepaleseNew ZealanderNicaraguanNigerianNorthern EuropeanNorwegianOkinawanOsageOttawaPaiutePakistaniPalestinianPanamanianParaguayanPennsylvania GermanPeruvianPimaPolishPortuguesePotawatomiPuebloPuerto RicanPuget Sound SalishRomanianRussianSalvadoranSamoanScandinavianScotch-IrishScottishSeminoleSenegaleseSerbianShoshoneSierra LeoneanSiouxSlavicSlovakSloveneSomaliSouth AfricanSouth AmericanSouth American IndianSoviet UnionSpaniardSpanishSpanish AmericanSpanish American IndianSri LankanSubsaharan AfricanSudaneseSwedishSwissSyrianTaiwaneseThaiTlingit-HaidaTohono O'OdhamTonganTrinidadian and TobagonianTsimshianTurkishU.S. Virgin IslanderUgandanUkrainianUruguayanUteVenezuelanVietnameseWelshWest IndianYakamaYaquiYugoslavianYumanYup'ikZimbabwean
Immigration
NonimmigrantsImmigrantsAfghanistanAfricaAlbaniaArgentinaArmeniaAsiaAustraliaAustriaBahamasBangladeshBarbadosBelarusBelgiumBelizeBoliviaBosnia and HerzegovinaBrazilBulgariaBurma/MyanmarCabo VerdeCambodiaCameroonCanadaCaribbeanCentral AmericaChileChinaColombiaCongoCosta RicaCroatiaCubaCzechoslovakiaDenmarkDominicaDominican RepublicEastern AfricaEastern AsiaEastern EuropeEcuadorEgyptEl SalvadorEnglandEritreaEthiopiaEuropeFijiFranceGermanyGhanaGreeceGrenadaGuatemalaGuyanaHaitiHondurasHong KongHungaryIndiaIndonesiaIranIraqIrelandIsraelItalyJamaicaJapanJordanKazakhstanKenyaKoreaKuwaitLaosLatin AmericaLatviaLebanonLiberiaLithuaniaMalaysiaMexicoMicronesiaMiddle AfricaMoldovaMoroccoNepalNetherlandsNicaraguaNigeriaNorth AmericaNorth MacedoniaNorthern AfricaNorthern EuropeNorwayOceaniaPakistanPanamaPeruPhilippinesPolandPortugalRomaniaRussiaSaudi ArabiaScotlandSenegalSerbiaSierra LeoneSingaporeSomaliaSouth AfricaSouth AmericaSouth Central AsiaSouth Eastern AsiaSouthern EuropeSpainSri LankaSt. Vincent and the GrenadinesSudanSwedenSwitzerlandSyriaTaiwanThailandTrinidad and TobagoTurkeyUgandaUkraineUruguayUzbekistanVenezuelaVietnamWest IndiesWestern AfricaWestern AsiaWestern EuropeYemenZaireZimbabweAzores
Family Households with Children
Income
Poverty
Unemployment
Labor Participation
Family Structure
Vehicle Availability
Education Level
Disability

Family Households with Children Comparison

Blacks/African Americans

Immigrants from Ghana

Tragic
Exceptional
26.5%
FAMILY HOUSEHOLDS WITH CHILDREN
0.1/ 100
METRIC RATING
293rd/ 347
METRIC RANK
28.6%
FAMILY HOUSEHOLDS WITH CHILDREN
99.9/ 100
METRIC RATING
61st/ 347
METRIC RANK

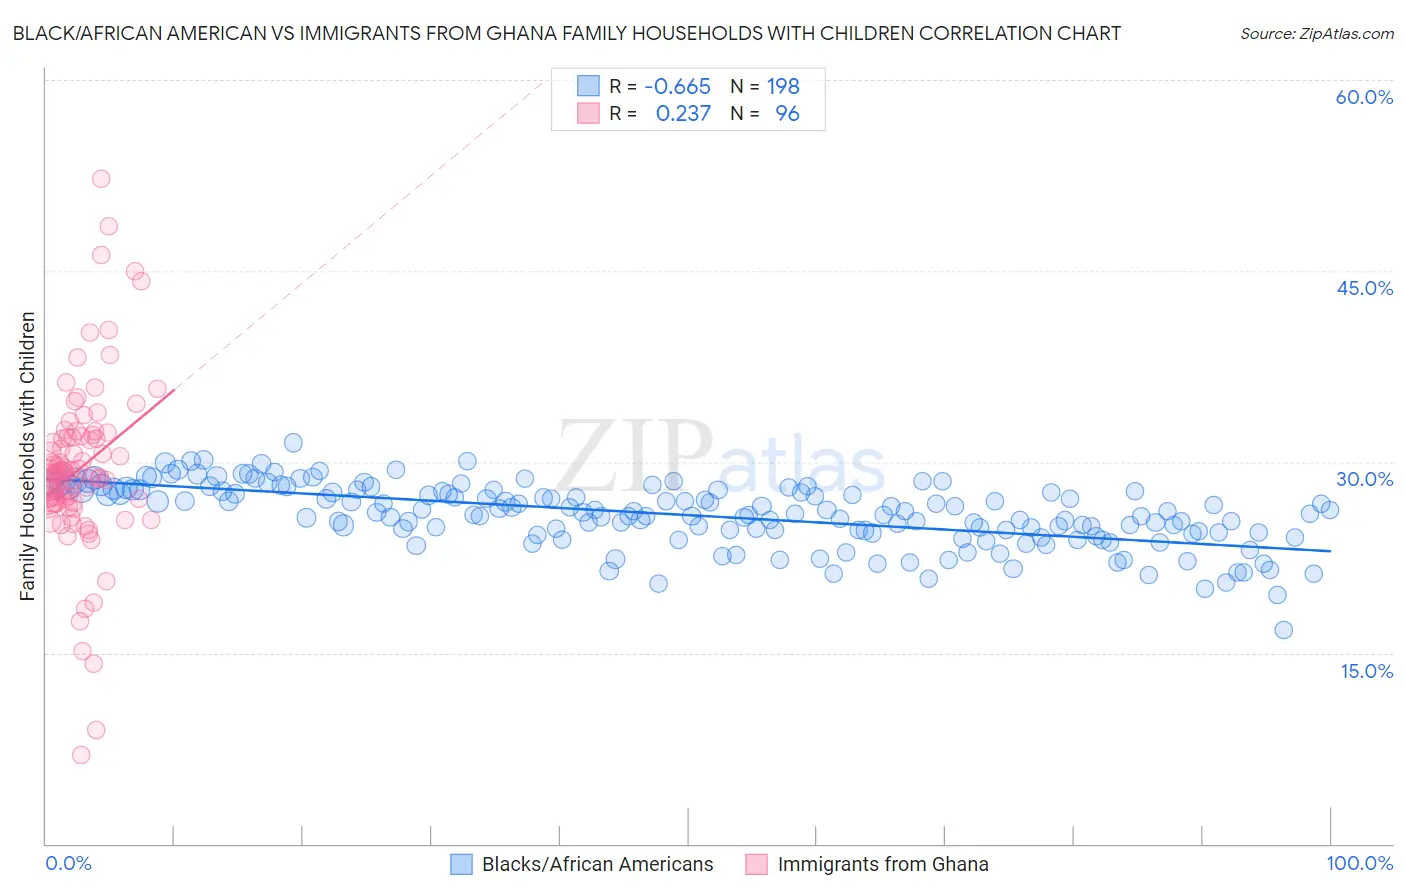
Black/African American vs Immigrants from Ghana Family Households with Children Correlation Chart

The statistical analysis conducted on geographies consisting of 564,937,994 people shows a significant negative correlation between the proportion of Blacks/African Americans and percentage of family households with children in the United States with a correlation coefficient (R) of -0.665 and weighted average of 26.5%. Similarly, the statistical analysis conducted on geographies consisting of 199,783,452 people shows a weak positive correlation between the proportion of Immigrants from Ghana and percentage of family households with children in the United States with a correlation coefficient (R) of 0.237 and weighted average of 28.6%, a difference of 8.0%.
Black/African American vs Immigrants from Ghana Family Households with Children

Family Households with Children Correlation Summary

MeasurementBlack/African AmericanImmigrants from Ghana
Minimum16.8%7.0%
Maximum31.5%52.2%
Range14.7%45.3%
Mean25.8%29.5%
Median26.0%29.1%
Interquartile 25% (IQ1)24.5%26.8%
Interquartile 75% (IQ3)27.7%31.9%
Interquartile Range (IQR)3.2%5.2%
Standard Deviation (Sample)2.5%6.9%
Standard Deviation (Population)2.4%6.9%

Similar Demographics by Family Households with Children

Demographics Similar to Blacks/African Americans by Family Households with Children

In terms of family households with children, the demographic groups most similar to Blacks/African Americans are Polish (26.5%, a difference of 0.050%), Albanian (26.5%, a difference of 0.060%), Bahamian (26.5%, a difference of 0.060%), Latvian (26.4%, a difference of 0.060%), and Macedonian (26.4%, a difference of 0.13%).
DemographicsRating | RankFamily Households with Children
Immigrants | Senegal
0.2
/100
|
#286
Tragic
26.5%
Shoshone
0.2
/100
|
#287
Tragic
26.5%
Russians
0.2
/100
|
#288
Tragic
26.5%
Immigrants | Sweden
0.2
/100
|
#289
Tragic
26.5%
Albanians
0.2
/100
|
#290
Tragic
26.5%
Bahamians
0.2
/100
|
#291
Tragic
26.5%
Poles
0.2
/100
|
#292
Tragic
26.5%
Blacks/African Americans
0.1
/100
|
#293
Tragic
26.5%
Latvians
0.1
/100
|
#294
Tragic
26.4%
Macedonians
0.1
/100
|
#295
Tragic
26.4%
Croatians
0.1
/100
|
#296
Tragic
26.4%
Armenians
0.1
/100
|
#297
Tragic
26.4%
Immigrants | Western Europe
0.1
/100
|
#298
Tragic
26.4%
Trinidadians and Tobagonians
0.1
/100
|
#299
Tragic
26.4%
Paiute
0.1
/100
|
#300
Tragic
26.4%

Demographics Similar to Immigrants from Ghana by Family Households with Children

In terms of family households with children, the demographic groups most similar to Immigrants from Ghana are Egyptian (28.6%, a difference of 0.0%), Immigrants from Lebanon (28.6%, a difference of 0.010%), Hmong (28.6%, a difference of 0.070%), Filipino (28.6%, a difference of 0.080%), and Immigrants from Nigeria (28.6%, a difference of 0.13%).
DemographicsRating | RankFamily Households with Children
Sierra Leoneans
100.0
/100
|
#54
Exceptional
28.9%
Immigrants | Asia
100.0
/100
|
#55
Exceptional
28.8%
Immigrants | Guatemala
100.0
/100
|
#56
Exceptional
28.8%
Danes
100.0
/100
|
#57
Exceptional
28.7%
Hawaiians
100.0
/100
|
#58
Exceptional
28.7%
Immigrants | Nigeria
100.0
/100
|
#59
Exceptional
28.6%
Hmong
99.9
/100
|
#60
Exceptional
28.6%
Immigrants | Ghana
99.9
/100
|
#61
Exceptional
28.6%
Egyptians
99.9
/100
|
#62
Exceptional
28.6%
Immigrants | Lebanon
99.9
/100
|
#63
Exceptional
28.6%
Filipinos
99.9
/100
|
#64
Exceptional
28.6%
Hondurans
99.9
/100
|
#65
Exceptional
28.5%
Immigrants | Egypt
99.9
/100
|
#66
Exceptional
28.5%
Ghanaians
99.9
/100
|
#67
Exceptional
28.5%
Houma
99.9
/100
|
#68
Exceptional
28.5%