Guamanian/Chamorro vs Immigrants from Moldova Family Households with Children

COMPARE

Guamanian/Chamorro
Race
Ancestry
AfghanAfricanAlaska NativeAlaskan AthabascanAlbanianAleutAlsatianAmericanApacheArabArapahoArgentineanArmenianAssyrian/Chaldean/SyriacAustralianAustrianBahamianBangladeshiBarbadianBasqueBelgianBelizeanBermudanBhutaneseBlackfeetBolivianBrazilianBritishBritish West IndianBulgarianBurmeseCajunCambodianCanadianCape VerdeanCarpatho RusynCelticCentral AmericanCentral American IndianCherokeeCheyenneChickasawChileanChineseChippewaChoctawColombianColvilleComancheCosta RicanCreeCreekCroatianCrowCubanCypriotCzechCzechoslovakianDanishDelawareDominicanDutchDutch West IndianEastern EuropeanEcuadorianEgyptianEnglishEstonianEthiopianEuropeanFijianFilipinoFinnishFrenchFrench American IndianFrench CanadianGermanGerman RussianGhanaianGreekGuamanian/ChamorroGuatemalanGuyaneseHaitianHmongHonduranHopiHoumaHungarianIcelanderIndian (Asian)IndonesianInupiatIranianIraqiIrishIroquoisIsraeliItalianJamaicanJapaneseJordanianKenyanKiowaKoreanLaotianLatvianLebaneseLiberianLithuanianLumbeeLuxembourgerMacedonianMalaysianMalteseMarshalleseMenomineeMexicanMexican American IndianMongolianMoroccanNative HawaiianNavajoNepaleseNew ZealanderNicaraguanNigerianNorthern EuropeanNorwegianOkinawanOsageOttawaPaiutePakistaniPalestinianPanamanianParaguayanPennsylvania GermanPeruvianPimaPolishPortuguesePotawatomiPuebloPuerto RicanPuget Sound SalishRomanianRussianSalvadoranSamoanScandinavianScotch-IrishScottishSeminoleSenegaleseSerbianShoshoneSierra LeoneanSiouxSlavicSlovakSloveneSomaliSouth AfricanSouth AmericanSouth American IndianSoviet UnionSpaniardSpanishSpanish AmericanSpanish American IndianSri LankanSubsaharan AfricanSudaneseSwedishSwissSyrianTaiwaneseThaiTlingit-HaidaTohono O'OdhamTonganTrinidadian and TobagonianTsimshianTurkishU.S. Virgin IslanderUgandanUkrainianUruguayanUteVenezuelanVietnameseWelshWest IndianYakamaYaquiYugoslavianYumanYup'ikZimbabwean
Immigration
NonimmigrantsImmigrantsAfghanistanAfricaAlbaniaArgentinaArmeniaAsiaAustraliaAustriaBahamasBangladeshBarbadosBelarusBelgiumBelizeBoliviaBosnia and HerzegovinaBrazilBulgariaBurma/MyanmarCabo VerdeCambodiaCameroonCanadaCaribbeanCentral AmericaChileChinaColombiaCongoCosta RicaCroatiaCubaCzechoslovakiaDenmarkDominicaDominican RepublicEastern AfricaEastern AsiaEastern EuropeEcuadorEgyptEl SalvadorEnglandEritreaEthiopiaEuropeFijiFranceGermanyGhanaGreeceGrenadaGuatemalaGuyanaHaitiHondurasHong KongHungaryIndiaIndonesiaIranIraqIrelandIsraelItalyJamaicaJapanJordanKazakhstanKenyaKoreaKuwaitLaosLatin AmericaLatviaLebanonLiberiaLithuaniaMalaysiaMexicoMicronesiaMiddle AfricaMoroccoNepalNetherlandsNicaraguaNigeriaNorth AmericaNorth MacedoniaNorthern AfricaNorthern EuropeNorwayOceaniaPakistanPanamaPeruPhilippinesPolandPortugalRomaniaRussiaSaudi ArabiaScotlandSenegalSerbiaSierra LeoneSingaporeSomaliaSouth AfricaSouth AmericaSouth Central AsiaSouth Eastern AsiaSouthern EuropeSpainSri LankaSt. Vincent and the GrenadinesSudanSwedenSwitzerlandSyriaTaiwanThailandTrinidad and TobagoTurkeyUgandaUkraineUruguayUzbekistanVenezuelaVietnamWest IndiesWestern AfricaWestern AsiaWestern EuropeYemenZaireZimbabweAzores
Immigrants from Moldova
Race
Ancestry
AfghanAfricanAlaska NativeAlaskan AthabascanAlbanianAleutAlsatianAmericanApacheArabArapahoArgentineanArmenianAssyrian/Chaldean/SyriacAustralianAustrianBahamianBangladeshiBarbadianBasqueBelgianBelizeanBermudanBhutaneseBlackfeetBolivianBrazilianBritishBritish West IndianBulgarianBurmeseCajunCambodianCanadianCape VerdeanCarpatho RusynCelticCentral AmericanCentral American IndianCherokeeCheyenneChickasawChileanChineseChippewaChoctawColombianColvilleComancheCosta RicanCreeCreekCroatianCrowCubanCypriotCzechCzechoslovakianDanishDelawareDominicanDutchDutch West IndianEastern EuropeanEcuadorianEgyptianEnglishEstonianEthiopianEuropeanFijianFilipinoFinnishFrenchFrench American IndianFrench CanadianGermanGerman RussianGhanaianGreekGuatemalanGuyaneseHaitianHmongHonduranHopiHoumaHungarianIcelanderIndian (Asian)IndonesianInupiatIranianIraqiIrishIroquoisIsraeliItalianJamaicanJapaneseJordanianKenyanKiowaKoreanLaotianLatvianLebaneseLiberianLithuanianLumbeeLuxembourgerMacedonianMalaysianMalteseMarshalleseMenomineeMexicanMexican American IndianMongolianMoroccanNative HawaiianNavajoNepaleseNew ZealanderNicaraguanNigerianNorthern EuropeanNorwegianOkinawanOsageOttawaPaiutePakistaniPalestinianPanamanianParaguayanPennsylvania GermanPeruvianPimaPolishPortuguesePotawatomiPuebloPuerto RicanPuget Sound SalishRomanianRussianSalvadoranSamoanScandinavianScotch-IrishScottishSeminoleSenegaleseSerbianShoshoneSierra LeoneanSiouxSlavicSlovakSloveneSomaliSouth AfricanSouth AmericanSouth American IndianSoviet UnionSpaniardSpanishSpanish AmericanSpanish American IndianSri LankanSubsaharan AfricanSudaneseSwedishSwissSyrianTaiwaneseThaiTlingit-HaidaTohono O'OdhamTonganTrinidadian and TobagonianTsimshianTurkishU.S. Virgin IslanderUgandanUkrainianUruguayanUteVenezuelanVietnameseWelshWest IndianYakamaYaquiYugoslavianYumanYup'ikZimbabwean
Immigration
NonimmigrantsImmigrantsAfghanistanAfricaAlbaniaArgentinaArmeniaAsiaAustraliaAustriaBahamasBangladeshBarbadosBelarusBelgiumBelizeBoliviaBosnia and HerzegovinaBrazilBulgariaBurma/MyanmarCabo VerdeCambodiaCameroonCanadaCaribbeanCentral AmericaChileChinaColombiaCongoCosta RicaCroatiaCubaCzechoslovakiaDenmarkDominicaDominican RepublicEastern AfricaEastern AsiaEastern EuropeEcuadorEgyptEl SalvadorEnglandEritreaEthiopiaEuropeFijiFranceGermanyGhanaGreeceGrenadaGuatemalaGuyanaHaitiHondurasHong KongHungaryIndiaIndonesiaIranIraqIrelandIsraelItalyJamaicaJapanJordanKazakhstanKenyaKoreaKuwaitLaosLatin AmericaLatviaLebanonLiberiaLithuaniaMalaysiaMexicoMicronesiaMiddle AfricaMoldovaMoroccoNepalNetherlandsNicaraguaNigeriaNorth AmericaNorth MacedoniaNorthern AfricaNorthern EuropeNorwayOceaniaPakistanPanamaPeruPhilippinesPolandPortugalRomaniaRussiaSaudi ArabiaScotlandSenegalSerbiaSierra LeoneSingaporeSomaliaSouth AfricaSouth AmericaSouth Central AsiaSouth Eastern AsiaSouthern EuropeSpainSri LankaSt. Vincent and the GrenadinesSudanSwedenSwitzerlandSyriaTaiwanThailandTrinidad and TobagoTurkeyUgandaUkraineUruguayUzbekistanVenezuelaVietnamWest IndiesWestern AfricaWestern AsiaWestern EuropeYemenZaireZimbabweAzores
Family Households with Children
Income
Poverty
Unemployment
Labor Participation
Family Structure
Vehicle Availability
Education Level
Disability

Family Households with Children Comparison

Guamanians/Chamorros

Immigrants from Moldova

Exceptional
Good
29.7%
FAMILY HOUSEHOLDS WITH CHILDREN
100.0/ 100
METRIC RATING
24th/ 347
METRIC RANK
27.6%
FAMILY HOUSEHOLDS WITH CHILDREN
79.1/ 100
METRIC RATING
147th/ 347
METRIC RANK

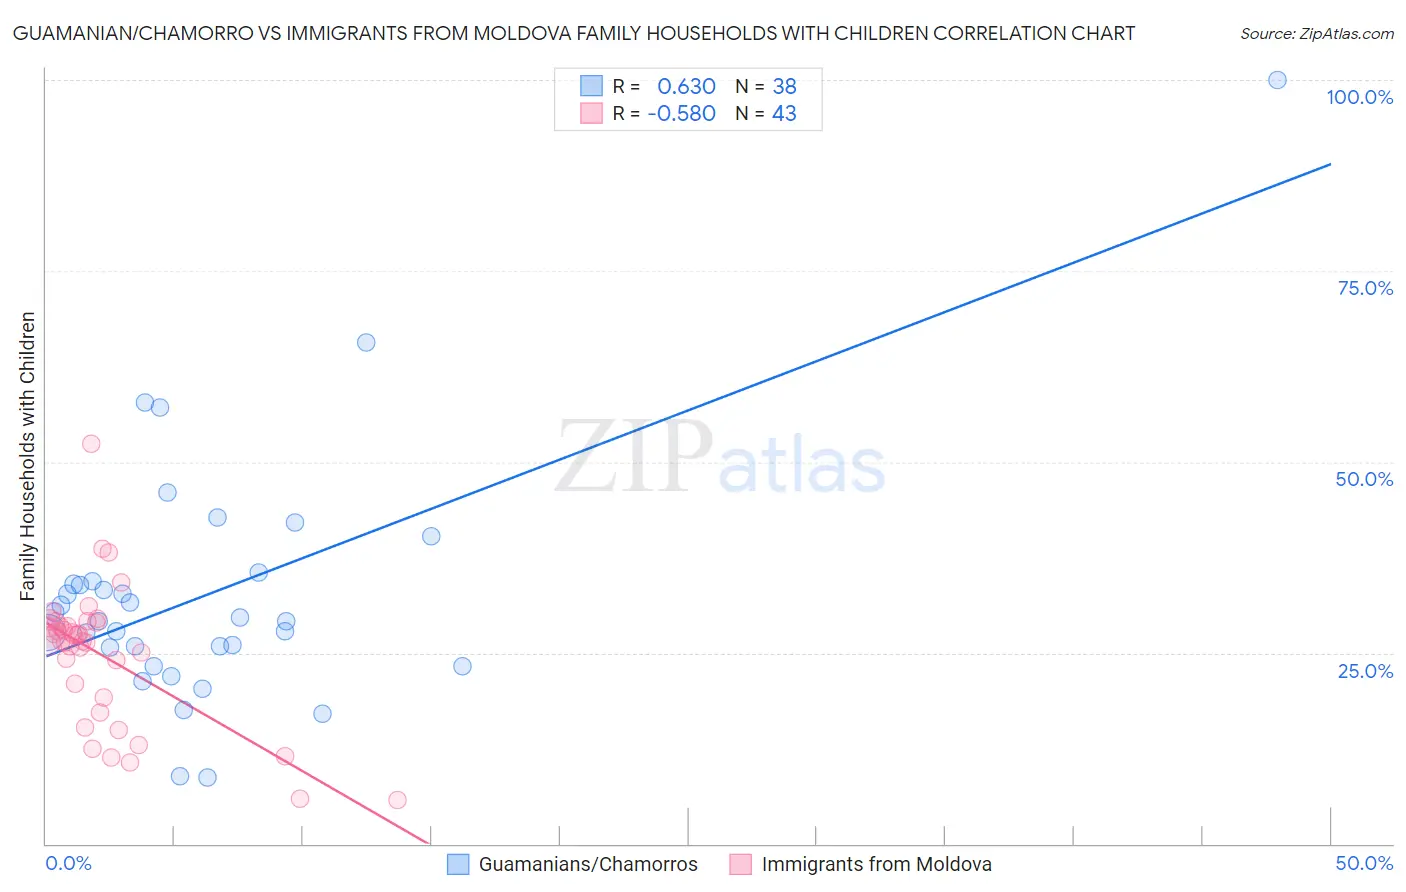
Guamanian/Chamorro vs Immigrants from Moldova Family Households with Children Correlation Chart

The statistical analysis conducted on geographies consisting of 221,827,817 people shows a significant positive correlation between the proportion of Guamanians/Chamorros and percentage of family households with children in the United States with a correlation coefficient (R) of 0.630 and weighted average of 29.7%. Similarly, the statistical analysis conducted on geographies consisting of 124,355,422 people shows a substantial negative correlation between the proportion of Immigrants from Moldova and percentage of family households with children in the United States with a correlation coefficient (R) of -0.580 and weighted average of 27.6%, a difference of 7.4%.
Guamanian/Chamorro vs Immigrants from Moldova Family Households with Children

Family Households with Children Correlation Summary

MeasurementGuamanian/ChamorroImmigrants from Moldova
Minimum8.6%5.6%
Maximum100.0%52.3%
Range91.4%46.7%
Mean32.8%24.7%
Median29.4%26.6%
Interquartile 25% (IQ1)25.8%19.1%
Interquartile 75% (IQ3)34.4%29.0%
Interquartile Range (IQR)8.7%9.9%
Standard Deviation (Sample)16.3%9.0%
Standard Deviation (Population)16.1%8.9%

Similar Demographics by Family Households with Children

Demographics Similar to Guamanians/Chamorros by Family Households with Children

In terms of family households with children, the demographic groups most similar to Guamanians/Chamorros are Mexican American Indian (29.7%, a difference of 0.10%), Immigrants from Latin America (29.7%, a difference of 0.10%), Malaysian (29.8%, a difference of 0.37%), Immigrants from Laos (29.8%, a difference of 0.41%), and Immigrants from El Salvador (29.8%, a difference of 0.45%).
DemographicsRating | RankFamily Households with Children
Hispanics or Latinos
100.0
/100
|
#17
Exceptional
29.9%
Salvadorans
100.0
/100
|
#18
Exceptional
29.9%
Alaska Natives
100.0
/100
|
#19
Exceptional
29.9%
Immigrants | El Salvador
100.0
/100
|
#20
Exceptional
29.8%
Immigrants | Laos
100.0
/100
|
#21
Exceptional
29.8%
Malaysians
100.0
/100
|
#22
Exceptional
29.8%
Mexican American Indians
100.0
/100
|
#23
Exceptional
29.7%
Guamanians/Chamorros
100.0
/100
|
#24
Exceptional
29.7%
Immigrants | Latin America
100.0
/100
|
#25
Exceptional
29.7%
Sri Lankans
100.0
/100
|
#26
Exceptional
29.5%
Immigrants | Vietnam
100.0
/100
|
#27
Exceptional
29.5%
Samoans
100.0
/100
|
#28
Exceptional
29.5%
Bolivians
100.0
/100
|
#29
Exceptional
29.5%
Yuman
100.0
/100
|
#30
Exceptional
29.5%
Japanese
100.0
/100
|
#31
Exceptional
29.4%

Demographics Similar to Immigrants from Moldova by Family Households with Children

In terms of family households with children, the demographic groups most similar to Immigrants from Moldova are Osage (27.6%, a difference of 0.0%), Immigrants from Chile (27.7%, a difference of 0.010%), Basque (27.7%, a difference of 0.010%), Menominee (27.6%, a difference of 0.010%), and Brazilian (27.7%, a difference of 0.020%).
DemographicsRating | RankFamily Households with Children
Spanish
81.8
/100
|
#140
Excellent
27.7%
Immigrants | Eastern Asia
81.7
/100
|
#141
Excellent
27.7%
Swiss
81.4
/100
|
#142
Excellent
27.7%
Immigrants | Eastern Africa
80.2
/100
|
#143
Excellent
27.7%
Brazilians
79.6
/100
|
#144
Good
27.7%
Immigrants | Chile
79.5
/100
|
#145
Good
27.7%
Basques
79.5
/100
|
#146
Good
27.7%
Immigrants | Moldova
79.1
/100
|
#147
Good
27.6%
Osage
79.0
/100
|
#148
Good
27.6%
Menominee
78.9
/100
|
#149
Good
27.6%
Argentineans
78.5
/100
|
#150
Good
27.6%
Portuguese
77.8
/100
|
#151
Good
27.6%
Ethiopians
77.0
/100
|
#152
Good
27.6%
Immigrants | Cabo Verde
75.6
/100
|
#153
Good
27.6%
Icelanders
75.3
/100
|
#154
Good
27.6%