Guamanian/Chamorro vs Puget Sound Salish Family Households with Children
COMPARE
Guamanian/Chamorro
Puget Sound Salish
Family Households with Children
Family Households with Children Comparison
Guamanians/Chamorros
Puget Sound Salish
29.7%
FAMILY HOUSEHOLDS WITH CHILDREN
100.0/ 100
METRIC RATING
24th/ 347
METRIC RANK
27.4%
FAMILY HOUSEHOLDS WITH CHILDREN
46.2/ 100
METRIC RATING
182nd/ 347
METRIC RANK
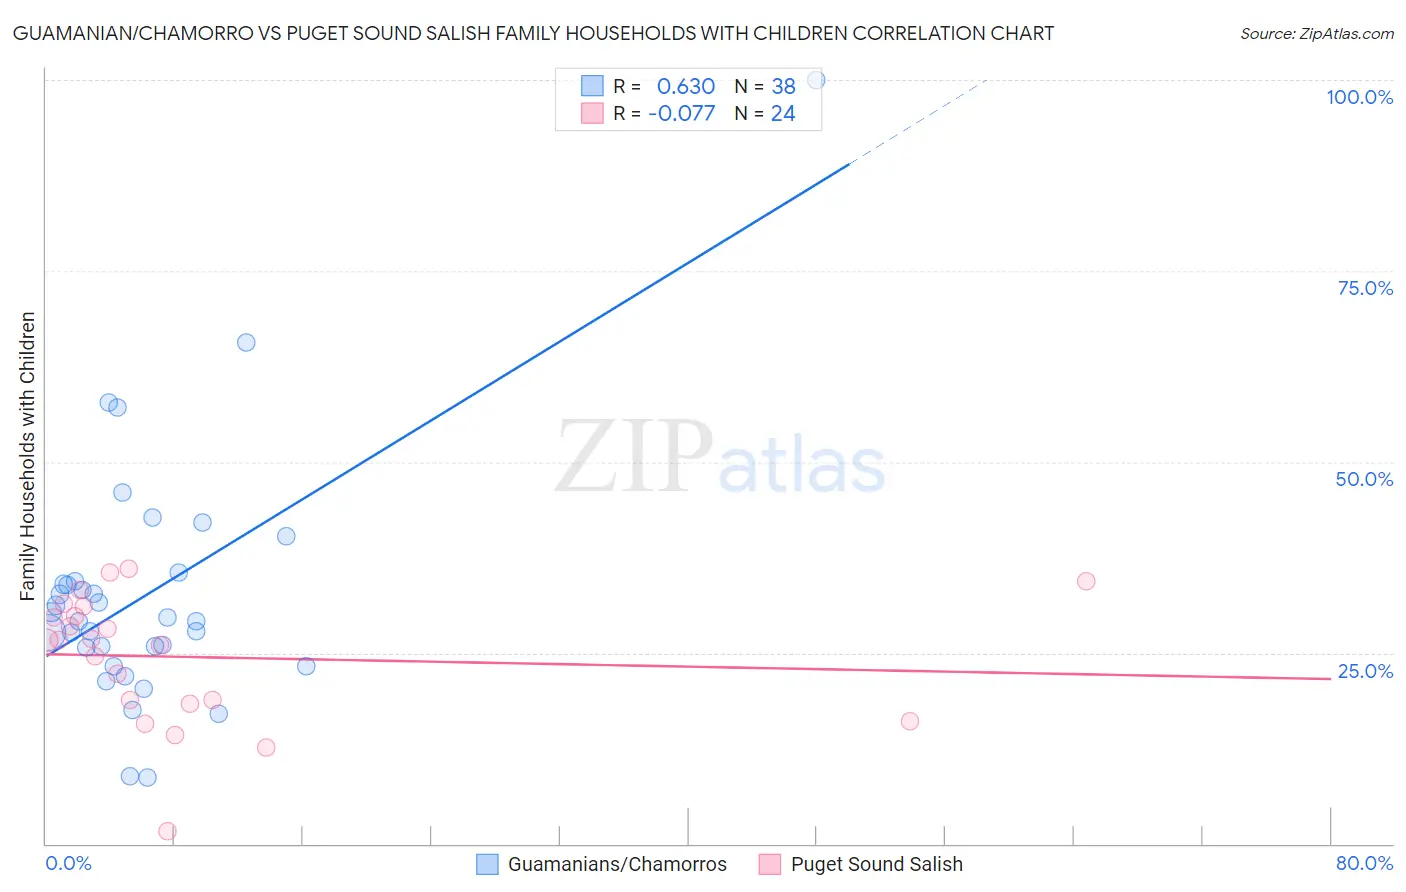
Guamanian/Chamorro vs Puget Sound Salish Family Households with Children Correlation Chart
The statistical analysis conducted on geographies consisting of 221,827,817 people shows a significant positive correlation between the proportion of Guamanians/Chamorros and percentage of family households with children in the United States with a correlation coefficient (R) of 0.630 and weighted average of 29.7%. Similarly, the statistical analysis conducted on geographies consisting of 46,155,538 people shows a slight negative correlation between the proportion of Puget Sound Salish and percentage of family households with children in the United States with a correlation coefficient (R) of -0.077 and weighted average of 27.4%, a difference of 8.3%.
Family Households with Children Correlation Summary
| Measurement | Guamanian/Chamorro | Puget Sound Salish |
| Minimum | 8.6% | 1.6% |
| Maximum | 100.0% | 36.0% |
| Range | 91.4% | 34.3% |
| Mean | 32.8% | 24.4% |
| Median | 29.4% | 26.7% |
| Interquartile 25% (IQ1) | 25.8% | 18.5% |
| Interquartile 75% (IQ3) | 34.4% | 30.4% |
| Interquartile Range (IQR) | 8.7% | 11.9% |
| Standard Deviation (Sample) | 16.3% | 8.5% |
| Standard Deviation (Population) | 16.1% | 8.3% |
Similar Demographics by Family Households with Children
Demographics Similar to Guamanians/Chamorros by Family Households with Children
In terms of family households with children, the demographic groups most similar to Guamanians/Chamorros are Mexican American Indian (29.7%, a difference of 0.10%), Immigrants from Latin America (29.7%, a difference of 0.10%), Malaysian (29.8%, a difference of 0.37%), Immigrants from Laos (29.8%, a difference of 0.41%), and Immigrants from El Salvador (29.8%, a difference of 0.45%).
| Demographics | Rating | Rank | Family Households with Children |
| Hispanics or Latinos | 100.0 /100 | #17 | Exceptional 29.9% |
| Salvadorans | 100.0 /100 | #18 | Exceptional 29.9% |
| Alaska Natives | 100.0 /100 | #19 | Exceptional 29.9% |
| Immigrants | El Salvador | 100.0 /100 | #20 | Exceptional 29.8% |
| Immigrants | Laos | 100.0 /100 | #21 | Exceptional 29.8% |
| Malaysians | 100.0 /100 | #22 | Exceptional 29.8% |
| Mexican American Indians | 100.0 /100 | #23 | Exceptional 29.7% |
| Guamanians/Chamorros | 100.0 /100 | #24 | Exceptional 29.7% |
| Immigrants | Latin America | 100.0 /100 | #25 | Exceptional 29.7% |
| Sri Lankans | 100.0 /100 | #26 | Exceptional 29.5% |
| Immigrants | Vietnam | 100.0 /100 | #27 | Exceptional 29.5% |
| Samoans | 100.0 /100 | #28 | Exceptional 29.5% |
| Bolivians | 100.0 /100 | #29 | Exceptional 29.5% |
| Yuman | 100.0 /100 | #30 | Exceptional 29.5% |
| Japanese | 100.0 /100 | #31 | Exceptional 29.4% |
Demographics Similar to Puget Sound Salish by Family Households with Children
In terms of family households with children, the demographic groups most similar to Puget Sound Salish are Immigrants from Turkey (27.4%, a difference of 0.010%), Aleut (27.4%, a difference of 0.010%), Turkish (27.4%, a difference of 0.020%), South African (27.4%, a difference of 0.030%), and Native Hawaiian (27.4%, a difference of 0.040%).
| Demographics | Rating | Rank | Family Households with Children |
| British | 49.9 /100 | #175 | Average 27.4% |
| Immigrants | China | 49.6 /100 | #176 | Average 27.4% |
| Ugandans | 49.2 /100 | #177 | Average 27.4% |
| Spanish Americans | 48.9 /100 | #178 | Average 27.4% |
| Turks | 46.9 /100 | #179 | Average 27.4% |
| Immigrants | Turkey | 46.9 /100 | #180 | Average 27.4% |
| Aleuts | 46.7 /100 | #181 | Average 27.4% |
| Puget Sound Salish | 46.2 /100 | #182 | Average 27.4% |
| South Africans | 44.9 /100 | #183 | Average 27.4% |
| Native Hawaiians | 44.6 /100 | #184 | Average 27.4% |
| Delaware | 42.0 /100 | #185 | Average 27.4% |
| Immigrants | Brazil | 40.6 /100 | #186 | Average 27.4% |
| Creek | 39.8 /100 | #187 | Fair 27.4% |
| Dutch | 38.8 /100 | #188 | Fair 27.4% |
| Immigrants | Israel | 37.9 /100 | #189 | Fair 27.4% |